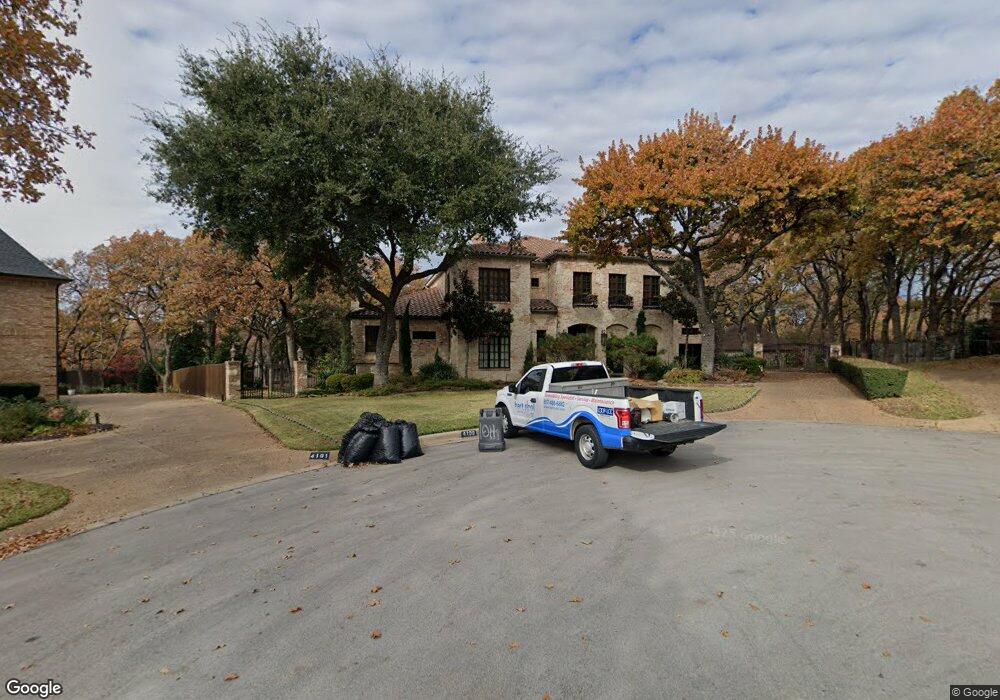
4100 Oxford Ct Colleyville, TX 76034
Estimated Value: $1,131,000 - $1,536,315
5
Beds
5
Baths
5,462
Sq Ft
$253/Sq Ft
Est. Value
About This Home
This home is located at 4100 Oxford Ct, Colleyville, TX 76034 and is currently estimated at $1,382,079, approximately $253 per square foot. 4100 Oxford Ct is a home located in Tarrant County with nearby schools including Heritage Elementary School and Colleyville Middle School.
Ownership History
Date
Name
Owned For
Owner Type
Purchase Details
Closed on
Feb 6, 2020
Sold by
Skinner Richard Mark
Bought by
Skinner Richard Mark
Current Estimated Value
Purchase Details
Closed on
Jul 14, 2003
Sold by
Skinner Richard Mark
Bought by
Holloway Valerie L
Home Financials for this Owner
Home Financials are based on the most recent Mortgage that was taken out on this home.
Original Mortgage
$600,000
Interest Rate
5.25%
Mortgage Type
Purchase Money Mortgage
Purchase Details
Closed on
Mar 28, 2003
Sold by
Capello Juan J
Bought by
Skinner Richard Mark
Purchase Details
Closed on
Sep 10, 1997
Sold by
Corcoran Thomas J and Corcoran Kathleen J
Bought by
Capello Juan J
Home Financials for this Owner
Home Financials are based on the most recent Mortgage that was taken out on this home.
Original Mortgage
$685,600
Interest Rate
7.48%
Create a Home Valuation Report for This Property
The Home Valuation Report is an in-depth analysis detailing your home's value as well as a comparison with similar homes in the area
Home Values in the Area
Average Home Value in this Area
Purchase History
| Date | Buyer | Sale Price | Title Company |
|---|---|---|---|
| Skinner Richard Mark | -- | None Available | |
| Holloway Valerie L | -- | Rattikin Title Co | |
| Skinner Richard Mark | -- | Rattikin Title Co | |
| Capello Juan J | -- | Safeco Land Title |
Source: Public Records
Mortgage History
| Date | Status | Borrower | Loan Amount |
|---|---|---|---|
| Closed | Holloway Valerie L | $600,000 | |
| Previous Owner | Capello Juan J | $685,600 |
Source: Public Records
Tax History Compared to Growth
Tax History
| Year | Tax Paid | Tax Assessment Tax Assessment Total Assessment is a certain percentage of the fair market value that is determined by local assessors to be the total taxable value of land and additions on the property. | Land | Improvement |
|---|---|---|---|---|
| 2025 | $4,991 | $1,265,000 | $326,260 | $938,740 |
| 2024 | $4,991 | $1,374,556 | $326,260 | $1,048,296 |
| 2023 | $20,411 | $1,421,144 | $326,260 | $1,094,884 |
| 2022 | $21,725 | $1,166,000 | $326,260 | $839,740 |
| 2021 | $21,961 | $1,000,000 | $301,260 | $698,740 |
| 2020 | $20,313 | $1,035,096 | $301,260 | $733,836 |
| 2019 | $19,213 | $831,030 | $125,000 | $706,030 |
| 2018 | $4,633 | $779,308 | $110,000 | $669,308 |
| 2017 | $18,963 | $1,004,904 | $110,000 | $894,904 |
| 2014 | $16,267 | $710,500 | $60,000 | $650,500 |
Source: Public Records
Map
Nearby Homes
- 2904 Hickory Hill St
- 2904 Hickory Hill Ln
- 3909 Allendale St
- 4300 Eaton Cir
- 3713 Teal Ln
- 3013 Bent Tree Ln
- 4309 Meandering Way
- 3816 Rolling Meadows Dr
- 4001 Fairmont Ct
- 2609 Talisman Ct
- 2201 Oak Knoll Ct
- 3409 Langley Hill Ln
- 3112 Hazlewood Ct
- 3900 Jackson Rd
- 3405 Scenic Hills Dr
- 4208 Lombardy Ct
- 3017 Bluebonnet Ln
- Seaberry II Plan at Grace Park - Signature Series
- Primrose FE V Plan at Grace Park - Signature Series
- Hawthorne Plan at Grace Park - Signature Series
- 4101 Oxford Ct
- 2909 Hickory Hill Ln
- 2905 Hickory Hill Ln
- 2913 Hickory Hill Ln
- 4101 Allendale St
- 4103 Oxford Ct
- 4104 Oxford Ct
- 3001 Hickory Hill Ln
- 2901 Hickory Hill Ln
- 4013 Allendale St
- 2920 Scarborough Ln W
- 4106 Oxford Ct
- 4101 Beckley Ct
- 3005 Hickory Hill Ln
- 4100 Beckley Ct
- 4100 Allendale St
- 2918 Scarborough Ln W
- 2908 Hickory Hill Ln
- 4104 Allendale St
- 4009 Allendale St