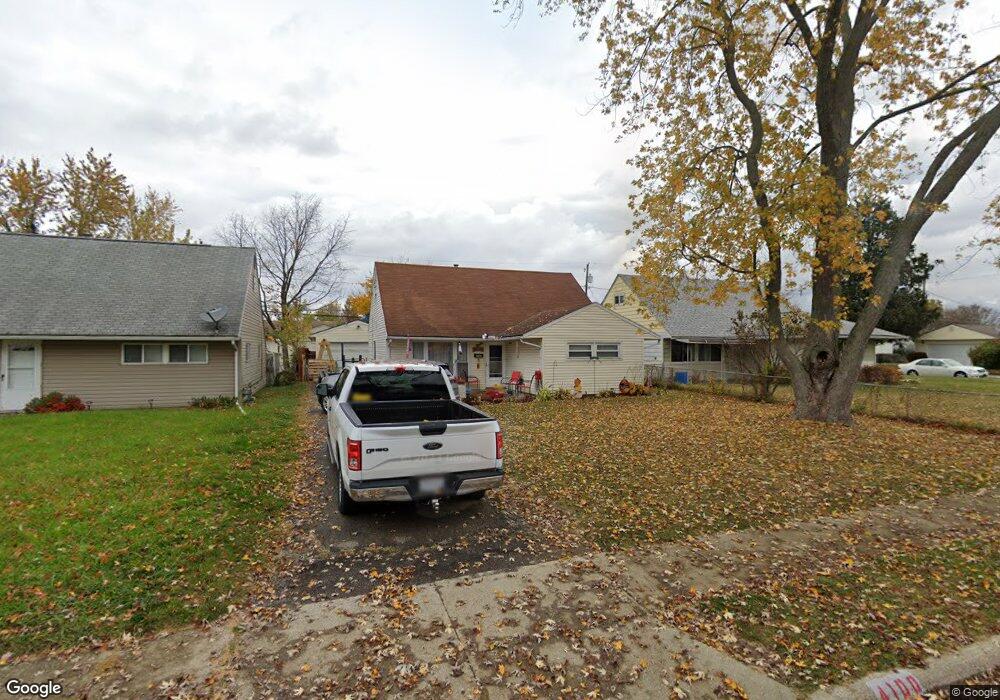
4100 Rickenbacker Ave Columbus, OH 43213
Estimated Value: $189,000 - $215,000
3
Beds
1
Bath
1,375
Sq Ft
$146/Sq Ft
Est. Value
About This Home
This home is located at 4100 Rickenbacker Ave, Columbus, OH 43213 and is currently estimated at $201,230, approximately $146 per square foot. 4100 Rickenbacker Ave is a home located in Franklin County with nearby schools including Beechwood Elementary School, Etna Road Elementary School, and Rosemore Middle School.
Ownership History
Date
Name
Owned For
Owner Type
Purchase Details
Closed on
Aug 30, 2019
Sold by
Vaynshel Elena and Shamis Simon
Bought by
Lms Yaffee Rental Properties Llc
Current Estimated Value
Home Financials for this Owner
Home Financials are based on the most recent Mortgage that was taken out on this home.
Original Mortgage
$68,080
Outstanding Balance
$43,843
Interest Rate
3.7%
Mortgage Type
Future Advance Clause Open End Mortgage
Estimated Equity
$157,387
Purchase Details
Closed on
Nov 20, 2017
Sold by
Miller Jimmy A and Alta Chutes I Llc
Bought by
Vaynsbel Elena and Shamis Simon
Purchase Details
Closed on
Sep 29, 2008
Sold by
Hatfield Jeffrey and King Laura
Bought by
Miller Jimmy A and Yager Patricia J
Home Financials for this Owner
Home Financials are based on the most recent Mortgage that was taken out on this home.
Original Mortgage
$97,850
Interest Rate
6.43%
Mortgage Type
FHA
Purchase Details
Closed on
Feb 8, 1991
Purchase Details
Closed on
Sep 8, 1989
Create a Home Valuation Report for This Property
The Home Valuation Report is an in-depth analysis detailing your home's value as well as a comparison with similar homes in the area
Home Values in the Area
Average Home Value in this Area
Purchase History
| Date | Buyer | Sale Price | Title Company |
|---|---|---|---|
| Lms Yaffee Rental Properties Llc | -- | Elite Land Title | |
| Vaynsbel Elena | $62,000 | None Available | |
| Miller Jimmy A | $97,900 | Land Sel Ti | |
| -- | -- | -- | |
| -- | $45,900 | -- |
Source: Public Records
Mortgage History
| Date | Status | Borrower | Loan Amount |
|---|---|---|---|
| Open | Lms Yaffee Rental Properties Llc | $68,080 | |
| Previous Owner | Miller Jimmy A | $97,850 |
Source: Public Records
Tax History
| Year | Tax Paid | Tax Assessment Tax Assessment Total Assessment is a certain percentage of the fair market value that is determined by local assessors to be the total taxable value of land and additions on the property. | Land | Improvement |
|---|---|---|---|---|
| 2025 | $2,321 | $51,840 | $17,150 | $34,690 |
| 2024 | $2,321 | $51,840 | $17,150 | $34,690 |
| 2023 | $2,305 | $51,835 | $17,150 | $34,685 |
| 2022 | $1,799 | $30,740 | $5,360 | $25,380 |
| 2021 | $1,691 | $30,740 | $5,360 | $25,380 |
| 2020 | $1,675 | $30,740 | $5,360 | $25,380 |
| 2019 | $2,484 | $24,080 | $4,270 | $19,810 |
| 2018 | $1,865 | $24,080 | $4,270 | $19,810 |
| 2017 | $1,867 | $24,080 | $4,270 | $19,810 |
| 2016 | $2,094 | $24,220 | $5,040 | $19,180 |
| 2015 | $1,744 | $24,220 | $5,040 | $19,180 |
| 2014 | $1,596 | $24,220 | $5,040 | $19,180 |
| 2013 | $844 | $26,915 | $5,600 | $21,315 |
Source: Public Records
Map
Nearby Homes
- 4212 Seigman Ave
- 4117 Elbern Ave
- 4105 Elbern Ave
- 4148 Elbern Ave
- 4174 Wright Park
- 695 Erickson Ave
- 746 S Yearling Rd
- 491 Westphal Ave
- 3840 Elbern Ave
- 798 S Yearling Rd
- 745 Pierce Ave
- 3814 Elbern Ave
- 320 Collingwood Ave
- 4481 Chandler Dr
- 225 Santa Maria Ln
- 3857 Doney St
- 4517 Saint Rita Ln
- 4308 E Main St Unit 1
- 706 Ross Rd
- 558 Maplewood Ave
- 4092 Rickenbacker Ave
- 4108 Rickenbacker Ave
- 4086 Rickenbacker Ave
- 4115 Etna St
- 4109 Etna St
- 4121 Etna St
- 4080 Rickenbacker Ave
- 4103 Etna St
- 4099 Rickenbacker Ave
- 4105 Rickenbacker Ave
- 4097 Etna St
- 4126 Rickenbacker Ave
- 4091 Rickenbacker Ave
- 4111 Rickenbacker Ave
- 4074 Rickenbacker Ave
- 4085 Rickenbacker Ave
- 4117 Rickenbacker Ave
- 4091 Etna St
- 4133 Etna St
- 4079 Rickenbacker Ave
Your Personal Tour Guide
Ask me questions while you tour the home.