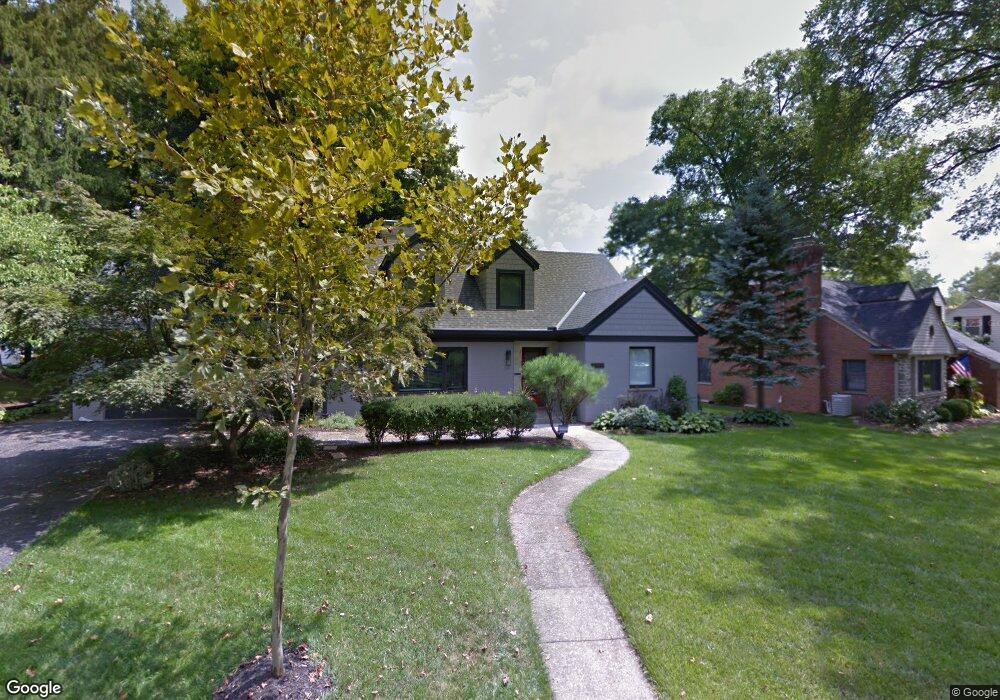
4100 Rowan Hill Dr Cincinnati, OH 45227
Estimated Value: $1,043,931 - $1,244,000
4
Beds
3
Baths
4,237
Sq Ft
$269/Sq Ft
Est. Value
About This Home
This home is located at 4100 Rowan Hill Dr, Cincinnati, OH 45227 and is currently estimated at $1,137,983, approximately $268 per square foot. 4100 Rowan Hill Dr is a home located in Hamilton County with nearby schools including Terrace Park Elementary School, Mariemont Elementary School, and Mariemont High School.
Ownership History
Date
Name
Owned For
Owner Type
Purchase Details
Closed on
Jan 15, 2010
Sold by
Ford John D and Ford Nicole L
Bought by
Weiss Ben T and Weiss Julie A
Current Estimated Value
Home Financials for this Owner
Home Financials are based on the most recent Mortgage that was taken out on this home.
Original Mortgage
$323,200
Outstanding Balance
$207,909
Interest Rate
4.87%
Mortgage Type
Unknown
Estimated Equity
$930,074
Purchase Details
Closed on
May 11, 2007
Sold by
Franke Annette M and Leesman Stephen W
Bought by
Ford John D and Ford Nicole L
Home Financials for this Owner
Home Financials are based on the most recent Mortgage that was taken out on this home.
Original Mortgage
$352,000
Interest Rate
6.21%
Mortgage Type
Unknown
Purchase Details
Closed on
Mar 28, 1994
Sold by
Angus Jennifer Lynn
Bought by
Franke Annette M
Home Financials for this Owner
Home Financials are based on the most recent Mortgage that was taken out on this home.
Original Mortgage
$157,500
Interest Rate
7.35%
Create a Home Valuation Report for This Property
The Home Valuation Report is an in-depth analysis detailing your home's value as well as a comparison with similar homes in the area
Home Values in the Area
Average Home Value in this Area
Purchase History
| Date | Buyer | Sale Price | Title Company |
|---|---|---|---|
| Weiss Ben T | $404,000 | Chicago Title Insurance Co | |
| Ford John D | $440,000 | Attorney | |
| Franke Annette M | -- | -- |
Source: Public Records
Mortgage History
| Date | Status | Borrower | Loan Amount |
|---|---|---|---|
| Open | Weiss Ben T | $323,200 | |
| Closed | Ford John D | $352,000 | |
| Closed | Franke Annette M | $157,500 |
Source: Public Records
Tax History
| Year | Tax Paid | Tax Assessment Tax Assessment Total Assessment is a certain percentage of the fair market value that is determined by local assessors to be the total taxable value of land and additions on the property. | Land | Improvement |
|---|---|---|---|---|
| 2025 | $21,042 | $298,858 | $71,092 | $227,766 |
| 2024 | $20,567 | $298,858 | $71,092 | $227,766 |
| 2023 | $18,969 | $298,858 | $71,092 | $227,766 |
| 2022 | $20,480 | $273,333 | $51,961 | $221,372 |
| 2021 | $19,991 | $273,333 | $51,961 | $221,372 |
| 2020 | $20,195 | $273,333 | $51,961 | $221,372 |
| 2019 | $19,417 | $239,768 | $45,581 | $194,187 |
| 2018 | $19,409 | $239,768 | $45,581 | $194,187 |
| 2017 | $16,519 | $239,768 | $45,581 | $194,187 |
| 2016 | $14,034 | $201,663 | $41,349 | $160,314 |
| 2015 | $14,184 | $201,663 | $41,349 | $160,314 |
| 2014 | $10,355 | $147,056 | $41,349 | $105,707 |
| 2013 | $9,490 | $141,400 | $39,760 | $101,640 |
Source: Public Records
Map
Nearby Homes
- 6975 Cambridge Ave
- 6949 Cambridge Ave
- 3817 Indianview Ave
- 3825 Petoskey Ave
- 4410 Miami Rd
- 3809 Petoskey Ave
- 3766 Miami Run
- 3746 Miami Run
- 3767 Miami Run
- 3750 Miami Run
- 3758 Miami Run
- 3771 Miami Run
- 3754 Miami Run
- 3762 Miami Run
- 6813 Merwin Ave
- 6867 Hurd Ave
- 14 Spring Knoll Dr
- 11 Spring Hill Dr
- 7411 Elm St
- 7406 Orchard St
- 4016 Rowan Hill Dr
- 4102 Rowan Hill Dr
- 6990 Haines Ave
- 4012 Rowan Hill Dr
- 6990 Haines St
- 6994 Haines Ave
- 6994 Haines St
- 4042 Lytle Woods Place
- 4101 Rowan Hill Dr
- 4046 Lytle Woods Place
- 4103 Rowan Hill Dr
- 6996 Haines St
- 6987 Grace Ave
- 4017 Rowan Hill Dr
- 6997 Rowan Hill Dr
- 4008 Rowan Hill Dr
- 6995 Haines Ave
- 6998 Haines Ave
- 6991 Cambridge Ave
- 6993 Cambridge Ave
Your Personal Tour Guide
Ask me questions while you tour the home.