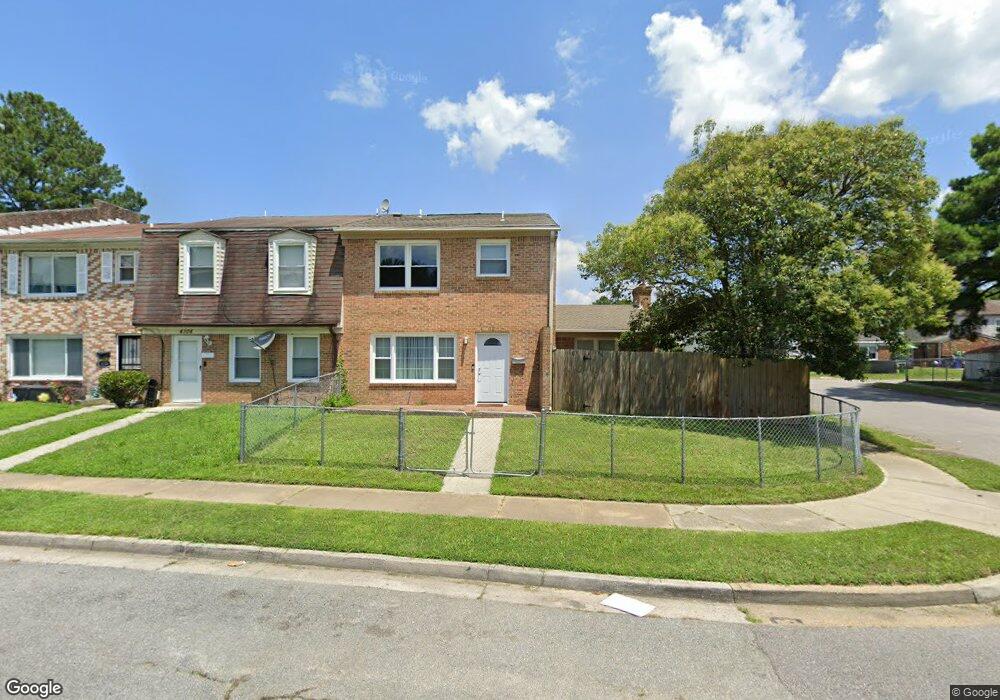
4100 Sloop Trail Chesapeake, VA 23321
Western Branch NeighborhoodEstimated Value: $194,000 - $314,916
3
Beds
3
Baths
2,376
Sq Ft
$99/Sq Ft
Est. Value
About This Home
This home is located at 4100 Sloop Trail, Chesapeake, VA 23321 and is currently estimated at $235,479, approximately $99 per square foot. 4100 Sloop Trail is a home located in Chesapeake City with nearby schools including Southwestern Elementary School, Jolliff Middle School, and Western Branch High School.
Ownership History
Date
Name
Owned For
Owner Type
Purchase Details
Closed on
Aug 1, 2022
Sold by
Duraid Alnaif
Bought by
Womack Malaysia
Current Estimated Value
Home Financials for this Owner
Home Financials are based on the most recent Mortgage that was taken out on this home.
Original Mortgage
$186,480
Outstanding Balance
$178,701
Interest Rate
5.81%
Mortgage Type
VA
Estimated Equity
$56,778
Purchase Details
Closed on
Dec 8, 2015
Sold by
Bank Of America Na
Bought by
Duraid Alnaif Declaration Of Trust Dated
Purchase Details
Closed on
Sep 21, 2015
Sold by
Equity Trustees Llc Sub Tr
Bought by
Bank Of America Na
Purchase Details
Closed on
Dec 22, 1999
Sold by
Miller Odie
Bought by
Richardson Melvin
Home Financials for this Owner
Home Financials are based on the most recent Mortgage that was taken out on this home.
Original Mortgage
$50,950
Interest Rate
7.61%
Create a Home Valuation Report for This Property
The Home Valuation Report is an in-depth analysis detailing your home's value as well as a comparison with similar homes in the area
Home Values in the Area
Average Home Value in this Area
Purchase History
| Date | Buyer | Sale Price | Title Company |
|---|---|---|---|
| Womack Malaysia | $180,000 | Jones Robert D | |
| Womack Malaysia | $180,000 | Jones Robert D | |
| Duraid Alnaif Declaration Of Trust Dated | $35,500 | Service Link | |
| Bank Of America Na | $43,665 | None Available | |
| Richardson Melvin | $51,000 | -- |
Source: Public Records
Mortgage History
| Date | Status | Borrower | Loan Amount |
|---|---|---|---|
| Open | Womack Malaysia | $186,480 | |
| Closed | Womack Malaysia | $186,480 | |
| Previous Owner | Richardson Melvin | $50,950 |
Source: Public Records
Tax History
| Year | Tax Paid | Tax Assessment Tax Assessment Total Assessment is a certain percentage of the fair market value that is determined by local assessors to be the total taxable value of land and additions on the property. | Land | Improvement |
|---|---|---|---|---|
| 2025 | $1,829 | $203,500 | $45,000 | $158,500 |
| 2024 | $1,829 | $181,100 | $40,000 | $141,100 |
| 2023 | $1,528 | $151,300 | $30,000 | $121,300 |
| 2022 | $1,160 | $114,900 | $20,000 | $94,900 |
| 2021 | $1,138 | $108,400 | $20,000 | $88,400 |
| 2020 | $1,071 | $102,000 | $20,000 | $82,000 |
| 2019 | $249 | $94,700 | $20,000 | $74,700 |
| 2018 | $759 | $72,300 | $25,000 | $47,300 |
| 2017 | $813 | $77,400 | $25,000 | $52,400 |
| 2016 | $759 | $72,300 | $25,000 | $47,300 |
| 2015 | $784 | $74,700 | $25,000 | $49,700 |
| 2014 | $784 | $74,700 | $25,000 | $49,700 |
Source: Public Records
Map
Nearby Homes
- 4008 Sloop Trail
- 3860 Schooner Trail
- 4304 Center Mast Crest
- 4122 Riverside Dr
- 3980 Port Rd
- 3931 Port Rd
- 3924 Port Rd
- 3932 Pierce Ln
- .2ac Airline Blvd
- 3861 Ahoy Dr
- 4004 River Breeze Cir
- 4126 River Breeze Cir
- 3917 Rex Cir
- 3932 Colony Pointe Dr
- 3709 Bosun Dr
- 1908 Rosemary Ln
- 1432 Pine Grove Ln
- 4015 Garwood Ave
- 4073 Maple Dr
- 102 Ben Hogan Dr
- 4104 Sloop Trail
- 4108 Sloop Trail
- 4112 Sloop Trail
- 4084 Sloop Trail
- 4116 Sloop Trail
- 4080 Sloop Trail
- 4120 Sloop Trail
- 4076 Sloop Trail
- 4101 Holly Cove Dr
- 4105 Holly Cove Dr
- 4109 Holly Cove Dr
- 4072 Sloop Trail
- 4113 Holly Cove Dr
- 4073 Holly Cove Dr
- 4068 Sloop Trail
- 4124 Sloop Trail
- 4117 Holly Cove Dr
- 4121 Holly Cove Dr
- 4060 Schooner Trail
- 4069 Holly Cove Dr
Your Personal Tour Guide
Ask me questions while you tour the home.