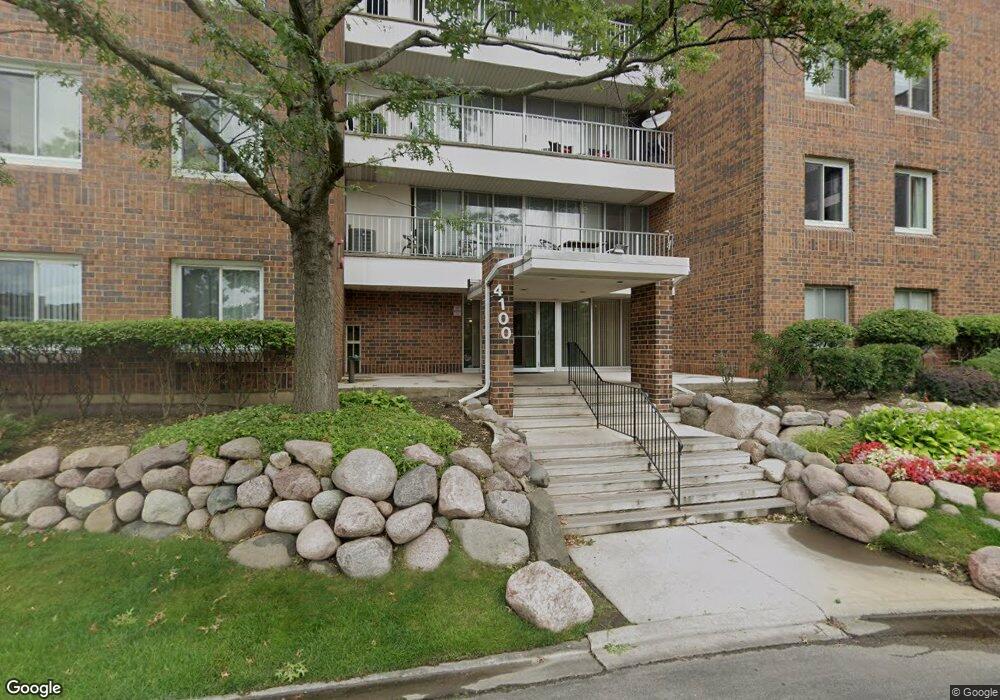
4100 Triumvera Dr Unit B503 Glenview, IL 60025
Estimated Value: $248,287 - $385,000
2
Beds
--
Bath
1,611
Sq Ft
$197/Sq Ft
Est. Value
About This Home
This home is located at 4100 Triumvera Dr Unit B503, Glenview, IL 60025 and is currently estimated at $316,572, approximately $196 per square foot. 4100 Triumvera Dr Unit B503 is a home located in Cook County with nearby schools including Henking Elementary School, Hoffman Elementary School, and Springman Middle School.
Ownership History
Date
Name
Owned For
Owner Type
Purchase Details
Closed on
Jun 14, 2004
Sold by
Cogan Richard V and Lanter Orrel J
Bought by
Kim Seung Tai and Kim Jeong Eun
Current Estimated Value
Home Financials for this Owner
Home Financials are based on the most recent Mortgage that was taken out on this home.
Original Mortgage
$180,800
Outstanding Balance
$83,491
Interest Rate
5.5%
Mortgage Type
New Conventional
Estimated Equity
$233,081
Purchase Details
Closed on
May 13, 2003
Sold by
Cogan Leo and Cogan Zella
Bought by
Cogan Leo M and Cogan Zella B
Purchase Details
Closed on
Dec 14, 2000
Sold by
Lasalle Bank National Assn
Bought by
Cogan Leo and Cogan Zella
Home Financials for this Owner
Home Financials are based on the most recent Mortgage that was taken out on this home.
Original Mortgage
$138,000
Interest Rate
7.83%
Create a Home Valuation Report for This Property
The Home Valuation Report is an in-depth analysis detailing your home's value as well as a comparison with similar homes in the area
Home Values in the Area
Average Home Value in this Area
Purchase History
| Date | Buyer | Sale Price | Title Company |
|---|---|---|---|
| Kim Seung Tai | $226,000 | -- | |
| Cogan Leo M | -- | -- | |
| Cogan Leo M | -- | -- | |
| Cogan Leo | $172,500 | -- |
Source: Public Records
Mortgage History
| Date | Status | Borrower | Loan Amount |
|---|---|---|---|
| Open | Kim Seung Tai | $180,800 | |
| Previous Owner | Cogan Leo | $138,000 | |
| Closed | Kim Seung Tai | $20,000 |
Source: Public Records
Tax History
| Year | Tax Paid | Tax Assessment Tax Assessment Total Assessment is a certain percentage of the fair market value that is determined by local assessors to be the total taxable value of land and additions on the property. | Land | Improvement |
|---|---|---|---|---|
| 2025 | $4,021 | $26,167 | $566 | $25,601 |
| 2024 | $4,021 | $20,401 | $479 | $19,922 |
| 2023 | $3,769 | $20,401 | $479 | $19,922 |
| 2022 | $3,769 | $20,401 | $479 | $19,922 |
| 2021 | $3,483 | $16,794 | $326 | $16,468 |
| 2020 | $3,520 | $16,794 | $326 | $16,468 |
| 2019 | $3,298 | $18,614 | $326 | $18,288 |
| 2018 | $2,838 | $15,134 | $283 | $14,851 |
| 2017 | $2,773 | $15,134 | $283 | $14,851 |
| 2016 | $2,808 | $15,134 | $283 | $14,851 |
| 2015 | $2,406 | $12,299 | $228 | $12,071 |
| 2014 | $2,367 | $12,299 | $228 | $12,071 |
| 2013 | $2,286 | $12,299 | $228 | $12,071 |
Source: Public Records
Map
Nearby Homes
- 4000 Triumvera Dr Unit A507
- 4000 Triumvera Dr Unit 201A
- 10385 Dearlove Rd Unit 1I
- 701 Forum Square Unit 102
- 3732 Capri Ct Unit T18A
- 3700 Capri Ct Unit 510
- 600 Naples Ct Unit 107
- 4170 Cove Ln Unit 2B
- 684 Quincy Bridge Ln Unit 302
- 3724 Liberty Ln
- 1018 Castilian Ct Unit A205
- 1026 Castilian Ct Unit D162
- 1002 Castilian Ct Unit B302
- 3505 Linneman St
- 9517 W Central Rd
- 3843 Springdale Ave
- 606 Greendale Rd
- 3420 Greenbriar Dr
- 524 Hazelwood Ln
- 1223 Milwaukee Ave
- 4100 Triumvera Dr Unit 204B
- 4100 Triumvera Dr Unit B408
- 4100 Triumvera Dr Unit B204
- 4100 Triumvera Dr Unit B301
- 4100 Triumvera Dr Unit B206
- 4100 Triumvera Dr Unit B402
- 4100 Triumvera Dr Unit B401
- 4100 Triumvera Dr Unit B102
- 4100 Triumvera Dr Unit B501
- 4100 Triumvera Dr Unit B406
- 4100 Triumvera Dr Unit B103
- 4100 Triumvera Dr Unit B107
- 4100 Triumvera Dr Unit B508
- 4100 Triumvera Dr Unit B405
- 4100 Triumvera Dr Unit B306
- 4100 Triumvera Dr Unit B302
- 4100 Triumvera Dr Unit B403
- 4100 Triumvera Dr Unit B207
Your Personal Tour Guide
Ask me questions while you tour the home.