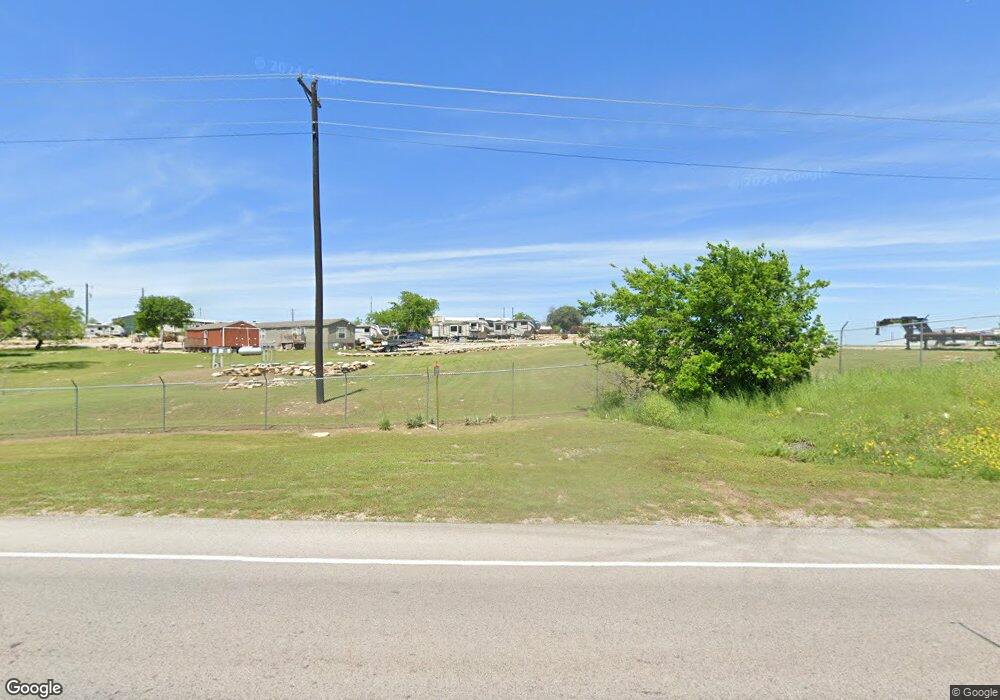
4100 W Interstate 20 Weatherford, TX 76088
Estimated Value: $484,000 - $663,143
--
Bed
--
Bath
1,820
Sq Ft
$315/Sq Ft
Est. Value
About This Home
This home is located at 4100 W Interstate 20, Weatherford, TX 76088 and is currently estimated at $573,572, approximately $315 per square foot. 4100 W Interstate 20 is a home located in Parker County with nearby schools including Brock Intermediate School, Brock Junior High School, and Brock High School.
Ownership History
Date
Name
Owned For
Owner Type
Purchase Details
Closed on
Mar 31, 2024
Sold by
Greene Thomas Richard and Greene Beverly Jo
Bought by
Kuper Mark Pierre and Kuper Melissa Jo
Current Estimated Value
Purchase Details
Closed on
Jan 1, 2024
Sold by
Kuper Mark Pierre
Bought by
Kuper Melissa Jo
Purchase Details
Closed on
Jun 15, 2016
Sold by
Savanna Energy Services Usa Corp
Bought by
Kuper Properties Llc
Purchase Details
Closed on
Oct 14, 2008
Sold by
Genpar/Lafleur Properties Llc
Bought by
Kuper Properties Llc
Purchase Details
Closed on
Jun 20, 2006
Sold by
Wright Gregory R and Wright Lana
Bought by
Kuper Properties Llc
Purchase Details
Closed on
May 31, 2006
Sold by
A & J Industries Inc
Bought by
Kuper Properties Llc
Purchase Details
Closed on
Mar 7, 2006
Bought by
Kuper Properties Llc
Create a Home Valuation Report for This Property
The Home Valuation Report is an in-depth analysis detailing your home's value as well as a comparison with similar homes in the area
Home Values in the Area
Average Home Value in this Area
Purchase History
| Date | Buyer | Sale Price | Title Company |
|---|---|---|---|
| Kuper Mark Pierre | -- | None Listed On Document | |
| Kuper Melissa Jo | -- | None Listed On Document | |
| Kuper Properties Llc | -- | -- | |
| Kuper Properties Llc | -- | -- | |
| Kuper Properties Llc | -- | -- | |
| Kuper Properties Llc | -- | -- | |
| Kuper Properties Llc | -- | -- |
Source: Public Records
Tax History Compared to Growth
Tax History
| Year | Tax Paid | Tax Assessment Tax Assessment Total Assessment is a certain percentage of the fair market value that is determined by local assessors to be the total taxable value of land and additions on the property. | Land | Improvement |
|---|---|---|---|---|
| 2025 | $9,249 | $470,550 | $121,120 | $349,430 |
| 2024 | $9,249 | $500,220 | $115,880 | $384,340 |
| 2023 | $9,249 | $500,220 | $115,880 | $384,340 |
| 2022 | $6,823 | $336,080 | $57,930 | $278,150 |
| 2021 | $7,175 | $336,080 | $57,930 | $278,150 |
| 2020 | $4,130 | $189,530 | $34,870 | $154,660 |
| 2019 | $1,509 | $64,620 | $34,870 | $29,750 |
| 2018 | $5,065 | $216,360 | $23,390 | $192,970 |
| 2017 | $4,978 | $216,360 | $23,390 | $192,970 |
| 2016 | $3,929 | $170,800 | $18,690 | $152,110 |
| 2015 | $3,886 | $171,100 | $18,990 | $152,110 |
| 2014 | $3,403 | $149,290 | $17,850 | $131,440 |
Source: Public Records
Map
Nearby Homes
- 125 Summer Stone Ct
- 101 Trail Ridge
- 120 Trail Ridge
- 234 Trail Ridge
- 0 Quanah Hill Rd Unit 23872058
- 113 Laser Ln
- 123 Club House Dr
- 1060 Kessler Rd
- 788 W Canyon Creek Ln
- 150 Top Flight Dr
- 873 Canyon Creek Ln
- 833 N Savage Creek Ln
- TBD Ellis Dr
- 673 E Canyon Creek Ln
- 313 Canyon Creek Cir
- 162 Pinnacle Peak Ln
- 197 Pinnacle Peak Ln
- 393 Canyon Creek Cir
- 205 Pinnacle Peak Ln
- 151 Canyon Creek Ct
- 4158 W Hwy I-20 Unit 4-W
- 120 W Scenic Trail Unit 3
- 120 W Scenic Trail Unit 2
- 4174 W Interstate 20 Unit 3
- 4174 W Interstate 20 Unit 3
- 4180 W Interstate 20
- 4180 W Interstate 20 Unit 2
- 4180 W Interstate 20
- 4180 W Interstate 20
- 123 Hilltop Terrace
- 102 Summer Stone Ct
- 202 W Scenic Trail
- 106 Hill Top Ct
- 116 W Scenic Trail
- 128 Hilltop Terrace
- 101 Summer Stone Ct
- 4000 Interstate 20
- 4000 W Interstate 20
- 108 Summer Stone Ct
- 214 W Scenic Trail