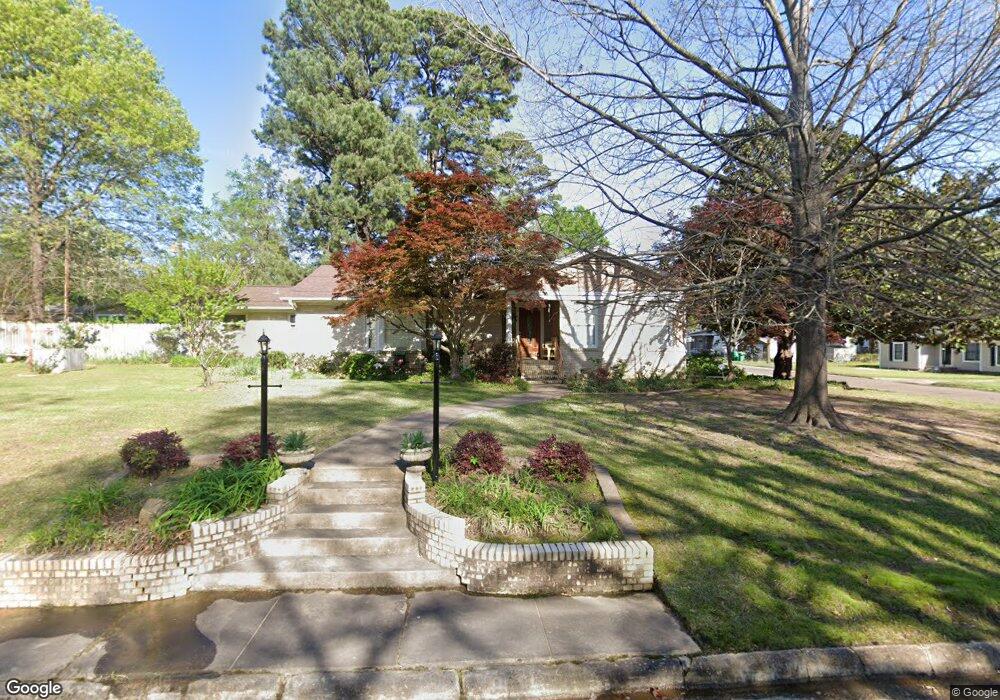
4100 Walnut St Texarkana, TX 75503
Estimated Value: $214,000 - $226,000
--
Bed
--
Bath
2,360
Sq Ft
$94/Sq Ft
Est. Value
About This Home
This home is located at 4100 Walnut St, Texarkana, TX 75503 and is currently estimated at $221,834, approximately $93 per square foot. 4100 Walnut St is a home located in Bowie County with nearby schools including Spring Lake Park Elementary School, Texas Middle School, and Texas High School.
Ownership History
Date
Name
Owned For
Owner Type
Purchase Details
Closed on
Sep 2, 2014
Sold by
Garland Shanika
Bought by
Thompson Patsy Ann
Current Estimated Value
Purchase Details
Closed on
Jun 25, 2009
Sold by
Strawn James R and Strawn Kathy J
Bought by
Shewmaker Michael
Home Financials for this Owner
Home Financials are based on the most recent Mortgage that was taken out on this home.
Original Mortgage
$127,187
Interest Rate
4.84%
Mortgage Type
FHA
Create a Home Valuation Report for This Property
The Home Valuation Report is an in-depth analysis detailing your home's value as well as a comparison with similar homes in the area
Home Values in the Area
Average Home Value in this Area
Purchase History
| Date | Buyer | Sale Price | Title Company |
|---|---|---|---|
| Thompson Patsy Ann | $43,625 | None Available | |
| Shewmaker Michael | -- | Stewart Title Of Texarkana |
Source: Public Records
Mortgage History
| Date | Status | Borrower | Loan Amount |
|---|---|---|---|
| Previous Owner | Shewmaker Michael | $127,187 |
Source: Public Records
Tax History Compared to Growth
Tax History
| Year | Tax Paid | Tax Assessment Tax Assessment Total Assessment is a certain percentage of the fair market value that is determined by local assessors to be the total taxable value of land and additions on the property. | Land | Improvement |
|---|---|---|---|---|
| 2025 | $1,380 | $238,615 | -- | -- |
| 2024 | $1,380 | $216,923 | $35,000 | $198,050 |
| 2023 | $2,288 | $197,203 | $0 | $0 |
| 2022 | $4,279 | $195,597 | $10,875 | $184,722 |
| 2021 | $4,167 | $162,977 | $10,875 | $152,102 |
| 2020 | $4,011 | $156,043 | $10,875 | $145,168 |
| 2019 | $3,986 | $149,441 | $10,875 | $138,566 |
| 2018 | $3,851 | $144,376 | $10,875 | $133,501 |
| 2017 | $3,774 | $141,877 | $10,875 | $131,002 |
| 2016 | $3,597 | $135,221 | $10,875 | $124,346 |
| 2015 | $2,845 | $134,091 | $10,875 | $123,216 |
| 2014 | $2,845 | $141,256 | $10,875 | $130,381 |
Source: Public Records
Map
Nearby Homes