Estimated Value: $274,000 - $433,000
3
Beds
2
Baths
1,610
Sq Ft
$212/Sq Ft
Est. Value
About This Home
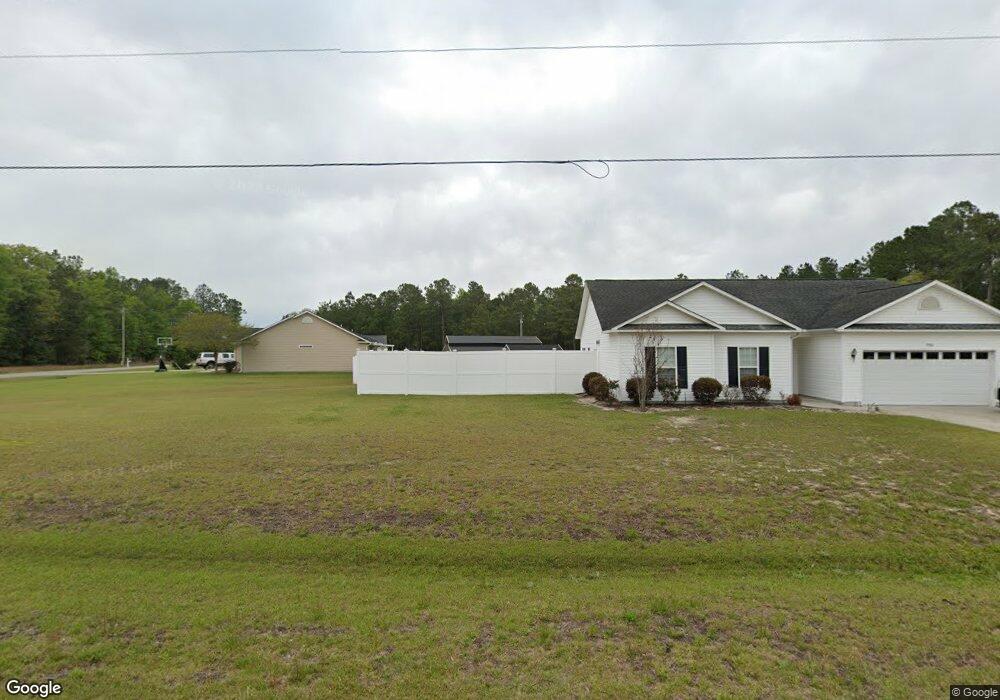
This home is located at 4101 Costie Allen Rd, Aynor, SC 29511 and is currently estimated at $340,673, approximately $211 per square foot. 4101 Costie Allen Rd is a home located in Horry County with nearby schools including Homewood Elementary School, Whittemore Park Middle School, and Conway High School.
Ownership History
Date
Name
Owned For
Owner Type
Purchase Details
Closed on
Sep 4, 2025
Sold by
Gus & Radley Investments Llc
Bought by
Humes Steven Wayne and Humes Crystal Gail
Current Estimated Value
Home Financials for this Owner
Home Financials are based on the most recent Mortgage that was taken out on this home.
Original Mortgage
$255,650
Outstanding Balance
$255,198
Interest Rate
6.63%
Mortgage Type
New Conventional
Estimated Equity
$85,475
Purchase Details
Closed on
Aug 1, 2019
Sold by
Bailey Joseph W
Bought by
Gus & Radley Investments Llc
Home Financials for this Owner
Home Financials are based on the most recent Mortgage that was taken out on this home.
Original Mortgage
$150,000
Interest Rate
3.7%
Mortgage Type
New Conventional
Purchase Details
Closed on
Sep 30, 2005
Sold by
Gaskins Robert A and Gaskins Laurie Ann
Bought by
Bailey Joseph W and Bailey Michelle Lynn
Purchase Details
Closed on
Feb 24, 2004
Sold by
Hughes Steven L
Bought by
Gaskins Robert A and Gaskins Laurie Ann
Purchase Details
Closed on
Feb 5, 2004
Sold by
Cannon Issac Lacy
Bought by
Hughes Steven L
Purchase Details
Closed on
Feb 4, 2004
Sold by
Conway National Bank
Bought by
Hughes Steven L
Create a Home Valuation Report for This Property
The Home Valuation Report is an in-depth analysis detailing your home's value as well as a comparison with similar homes in the area
Home Values in the Area
Average Home Value in this Area
Purchase History
| Date | Buyer | Sale Price | Title Company |
|---|---|---|---|
| Humes Steven Wayne | $275,000 | -- | |
| Gus & Radley Investments Llc | $94,381 | -- | |
| Bailey Joseph W | $164,000 | -- | |
| Gaskins Robert A | $45,300 | -- | |
| Hughes Steven L | $7,500 | -- | |
| Hughes Steven L | $25,000 | -- |
Source: Public Records
Mortgage History
| Date | Status | Borrower | Loan Amount |
|---|---|---|---|
| Open | Humes Steven Wayne | $255,650 | |
| Previous Owner | Gus & Radley Investments Llc | $150,000 |
Source: Public Records
Tax History Compared to Growth
Tax History
| Year | Tax Paid | Tax Assessment Tax Assessment Total Assessment is a certain percentage of the fair market value that is determined by local assessors to be the total taxable value of land and additions on the property. | Land | Improvement |
|---|---|---|---|---|
| 2024 | $2,276 | $17,859 | $5,952 | $11,907 |
| 2023 | $2,276 | $9,460 | $1,476 | $7,984 |
| 2021 | $2,102 | $10,535 | $1,535 | $9,000 |
| 2020 | $1,985 | $10,535 | $1,535 | $9,000 |
| 2019 | $1,985 | $10,535 | $1,535 | $9,000 |
| 2018 | $0 | $8,226 | $1,296 | $6,930 |
| 2017 | $1,780 | $8,226 | $1,296 | $6,930 |
| 2016 | -- | $8,226 | $1,296 | $6,930 |
| 2015 | $1,780 | $8,226 | $1,296 | $6,930 |
| 2014 | $1,721 | $8,226 | $1,296 | $6,930 |
Source: Public Records
Map
Nearby Homes
- 239 Canis Lupus Ln
- 4361 Costie Allen Rd
- 4195 Double Dee Rd
- 4959 Dupont Rd
- 4963 Dupont Rd
- 4971 Dupont Rd
- 4022 Macks Rd Unit LOT 1
- 6200 Adrian Pkwy
- 119 Gavin Hill Ct
- 125 Gavin Hill Ct
- TBD Louisville Rd
- TBD 5 Persimmon Rd
- 6900 Persimmon Rd
- TBD 222 Persimmon Rd
- TBB 4 Persimmon Rd
- 3747 Bakers Chapel Rd
- 159 Lister St
- 119 Bolsin Ct
- 158 Bolsin Ct
- 164 Bolsin Ct
- 3995 Costie Allen Rd
- 3989 Costie Allen Rd
- 7479 Louisville Rd
- 2352 Louisville Rd
- 7461 Louisville Rd Unit 7449 Louisville Rd
- 7461 Louisville Rd
- TBD Costie Allen Rd
- 0 Horse Creek Rd Unit 1501600
- 131 Canis Lupus Ln
- 3987 Horsecreek Rd
- 7401 Louisville Rd
- 7426 Louisville Rd
- 7405 Louisville Rd
- 3805 Horsecreek Rd
- TBD Horsecreek Rd
- 4297 Costie Allen Rd
- 7612 Louisville Rd
- 7395 Louisville Rd
- 3726 Marsden Rd
- 3725 Horsecreek Rd