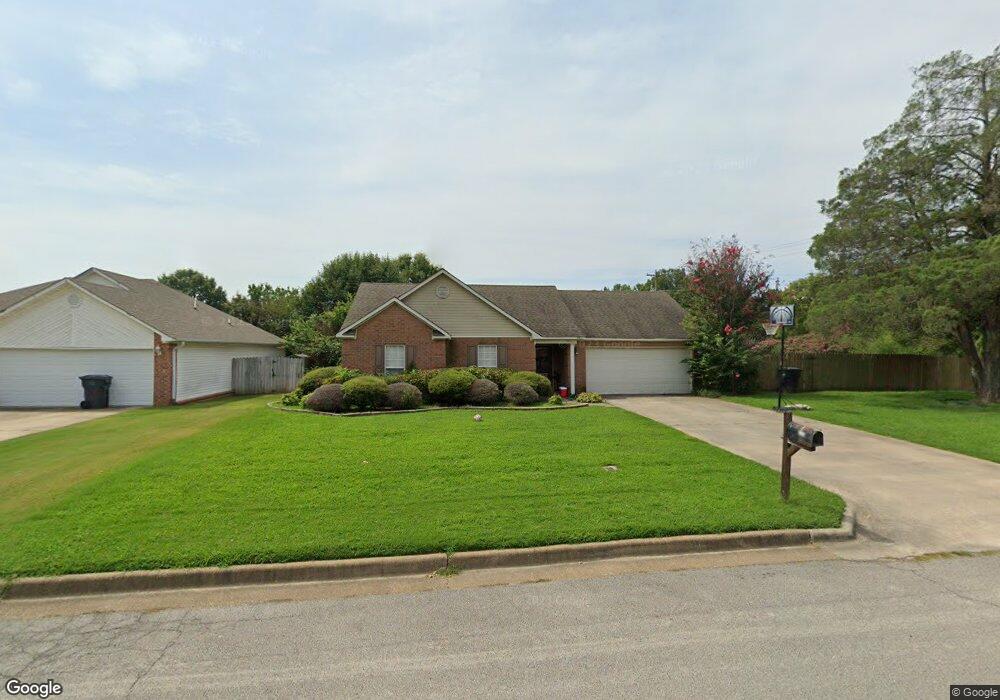
4101 Lynnfield Rd Jonesboro, AR 72401
Estimated Value: $181,692 - $215,000
3
Beds
2
Baths
1,430
Sq Ft
$142/Sq Ft
Est. Value
About This Home
This home is located at 4101 Lynnfield Rd, Jonesboro, AR 72401 and is currently estimated at $202,673, approximately $141 per square foot. 4101 Lynnfield Rd is a home located in Craighead County with nearby schools including Nettleton High School and Montessori School of Jonesboro.
Ownership History
Date
Name
Owned For
Owner Type
Purchase Details
Closed on
Nov 15, 2013
Bought by
Byrd Woodrow and Byrd Terri
Current Estimated Value
Purchase Details
Closed on
Oct 9, 2012
Sold by
Hallmark Lauren A Payne and Hallmark Michael
Bought by
Futrell Christopher and Futrell Kyla
Home Financials for this Owner
Home Financials are based on the most recent Mortgage that was taken out on this home.
Original Mortgage
$104,000
Interest Rate
3.61%
Mortgage Type
Purchase Money Mortgage
Purchase Details
Closed on
Jul 29, 2009
Sold by
Rodgers Jeremiah R and Rodgers Kristin E
Bought by
Payne Lauren A
Home Financials for this Owner
Home Financials are based on the most recent Mortgage that was taken out on this home.
Original Mortgage
$87,500
Interest Rate
5.41%
Mortgage Type
New Conventional
Purchase Details
Closed on
Jun 21, 2004
Bought by
Rodgers
Purchase Details
Closed on
Aug 30, 2000
Bought by
Scruggs
Purchase Details
Closed on
Mar 16, 2000
Bought by
Hugg
Create a Home Valuation Report for This Property
The Home Valuation Report is an in-depth analysis detailing your home's value as well as a comparison with similar homes in the area
Home Values in the Area
Average Home Value in this Area
Purchase History
| Date | Buyer | Sale Price | Title Company |
|---|---|---|---|
| Byrd Woodrow | $130,000 | -- | |
| Futrell Christopher | $130,000 | Lenders Title Company | |
| Payne Lauren A | $122,500 | None Available | |
| Rodgers | $106,000 | -- | |
| Scruggs | $94,000 | -- | |
| Hugg | $18,000 | -- |
Source: Public Records
Mortgage History
| Date | Status | Borrower | Loan Amount |
|---|---|---|---|
| Previous Owner | Futrell Christopher | $104,000 | |
| Previous Owner | Payne Lauren A | $87,500 |
Source: Public Records
Tax History Compared to Growth
Tax History
| Year | Tax Paid | Tax Assessment Tax Assessment Total Assessment is a certain percentage of the fair market value that is determined by local assessors to be the total taxable value of land and additions on the property. | Land | Improvement |
|---|---|---|---|---|
| 2025 | $1,445 | $30,064 | $3,500 | $26,564 |
| 2024 | $1,445 | $30,064 | $3,500 | $26,564 |
| 2023 | $1,387 | $30,064 | $3,500 | $26,564 |
| 2022 | $1,272 | $30,064 | $3,500 | $26,564 |
| 2021 | $1,190 | $24,760 | $3,400 | $21,360 |
| 2020 | $1,190 | $24,760 | $3,400 | $21,360 |
| 2019 | $1,190 | $24,760 | $3,400 | $21,360 |
| 2018 | $1,190 | $24,760 | $3,400 | $21,360 |
| 2017 | $1,144 | $24,760 | $3,400 | $21,360 |
| 2016 | $1,040 | $21,650 | $3,400 | $18,250 |
| 2015 | $1,040 | $21,650 | $3,400 | $18,250 |
| 2014 | $1,040 | $21,650 | $3,400 | $18,250 |
Source: Public Records
Map
Nearby Homes
- 1913 Millbranch Ln
- 1820 First Security Way
- 1 E Johnson Ave
- 2412 E Johnson Ave
- 0 E Johnson Ave Unit 25041081
- 1817 E Johnson Ave
- 3428 Hudson Dr
- 3413 Hudson Dr
- 3400 Hudson Dr
- 4120 Lynx Ln
- 1822 Old Greensboro Rd
- 4201 Lynx Ln
- 4141 Bobcat Meadow Ln
- 4145 Bobcat Meadow Ln
- 1008 Cypress Pointe Cove
- 0 Lot 37 & 38 Greensboro Rd Unit 25018313
- 4328 Lynx
- 4501 Montego Bay Cove
- 4357 Cypress Pointe Ln
- 4345 Cypress Pointe Ln
- 4105 Lynnfield Rd
- 4100 Lynnfield Rd
- 4109 Lynnfield Rd
- 4104 Lynnfield Rd
- 1906 Millbranch Ln
- 1902 Millbranch Ln
- 0 Lynnfield Rd
- 1910 Millbranch Ln
- 4108 Lynnfield Rd
- 1911 Pleasant Grove Rd
- 4112 Lynnfield Rd
- 1901 Millbranch Ln
- 4200 Lynnfield Rd
- 1908 Pleasant Grove Rd
- 4201 Lynnfield Rd
- 1905 Pleasant Grove Rd
- 4200 Walnut Bend Cove
- 1909 Millbranch Ln
- 1905 Millbranch Ln
- 1921 Pleasant Grove Rd