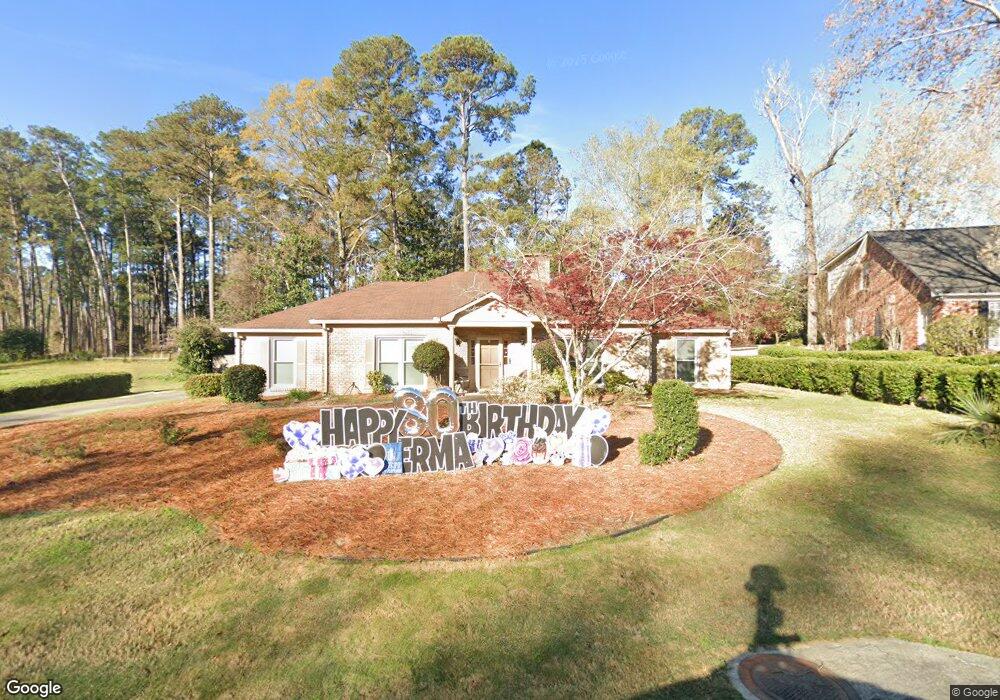
4101 Sears Rd Columbus, GA 31907
North Columbus NeighborhoodEstimated Value: $314,973 - $371,000
4
Beds
4
Baths
2,648
Sq Ft
$130/Sq Ft
Est. Value
About This Home
This home is located at 4101 Sears Rd, Columbus, GA 31907 and is currently estimated at $343,993, approximately $129 per square foot. 4101 Sears Rd is a home located in Muscogee County with nearby schools including Reese Road Leadership Academy, Midland Middle School, and Hardaway High School.
Ownership History
Date
Name
Owned For
Owner Type
Purchase Details
Closed on
Apr 7, 2017
Sold by
Welch George Michael
Bought by
Banks Erma D
Current Estimated Value
Home Financials for this Owner
Home Financials are based on the most recent Mortgage that was taken out on this home.
Original Mortgage
$220,190
Outstanding Balance
$183,231
Interest Rate
4.21%
Mortgage Type
New Conventional
Estimated Equity
$160,762
Purchase Details
Closed on
Dec 3, 2015
Sold by
Mosley Lawrence F
Bought by
Welch George Michael
Home Financials for this Owner
Home Financials are based on the most recent Mortgage that was taken out on this home.
Original Mortgage
$136,560
Interest Rate
3.91%
Mortgage Type
Commercial
Purchase Details
Closed on
Apr 17, 2012
Sold by
Mosley Sandra Satterfield
Bought by
Mosley Lawrence Flournoy
Home Financials for this Owner
Home Financials are based on the most recent Mortgage that was taken out on this home.
Original Mortgage
$114,000
Interest Rate
4.13%
Mortgage Type
New Conventional
Create a Home Valuation Report for This Property
The Home Valuation Report is an in-depth analysis detailing your home's value as well as a comparison with similar homes in the area
Home Values in the Area
Average Home Value in this Area
Purchase History
| Date | Buyer | Sale Price | Title Company |
|---|---|---|---|
| Banks Erma D | $227,000 | -- | |
| Welch George Michael | $140,000 | -- | |
| Mosley Lawrence Flournoy | -- | -- |
Source: Public Records
Mortgage History
| Date | Status | Borrower | Loan Amount |
|---|---|---|---|
| Open | Banks Erma D | $220,190 | |
| Previous Owner | Welch George Michael | $136,560 | |
| Previous Owner | Mosley Lawrence Flournoy | $114,000 |
Source: Public Records
Tax History
| Year | Tax Paid | Tax Assessment Tax Assessment Total Assessment is a certain percentage of the fair market value that is determined by local assessors to be the total taxable value of land and additions on the property. | Land | Improvement |
|---|---|---|---|---|
| 2025 | $2,587 | $101,364 | $18,596 | $82,768 |
| 2024 | $2,586 | $101,364 | $18,596 | $82,768 |
| 2023 | $1,908 | $101,364 | $18,596 | $82,768 |
| 2022 | $2,697 | $78,528 | $18,596 | $59,932 |
| 2021 | $2,690 | $79,268 | $18,596 | $60,672 |
| 2020 | $2,691 | $79,268 | $18,596 | $60,672 |
| 2019 | $2,701 | $79,268 | $18,596 | $60,672 |
| 2018 | $2,701 | $79,268 | $18,596 | $60,672 |
| 2017 | $3,258 | $79,268 | $18,596 | $60,672 |
| 2016 | $2,302 | $55,811 | $11,291 | $44,520 |
| 2015 | $1,340 | $61,644 | $11,291 | $50,353 |
| 2014 | $1,343 | $61,644 | $11,291 | $50,353 |
| 2013 | -- | $61,644 | $11,291 | $50,353 |
Source: Public Records
Map
Nearby Homes
- 4975 Glacier Dr
- 4819 Yosemite Dr
- 4738 Shenandoah Dr
- 4413 Dunstan Ct
- 4732 Delfair Dr
- 5302 Pine Needle Dr
- 4407 Florence Dr
- 4120 Fairview Dr
- 4118 Fairview Dr
- 2951 Florence Dr
- 5197 Kendal Ct
- 5590 Macon Rd
- 4220 Westfield Ct
- 4524 Hedingham Ln
- 2973 Grant Rd
- 4628 Sears Rd
- 4630 Fairview Dr
- 2841 Christine Rd
- 4444 Norcross Dr
- 4032 Pickering Dr
- 4107 Sears Rd
- 4049 Sears Rd
- 4114 Olympic Ln
- 4050 Sears Rd
- 4115 Sears Rd
- 4106 Sears Rd
- 4041 Sears Rd
- 4120 Olympic Ln
- 4114 Sears Rd
- 4036 Sears Rd
- 3905 Timbalier Dr
- 4115 Olympic Ln
- 4123 Sears Rd
- 4035 Sears Rd
- 4126 Olympic Ln
- 3911 Timbalier Dr
- 5002 Yosemite Dr
- 2 Yosemite Ct
- 3 Yosemite Ct
- 4119 Olympic Ln