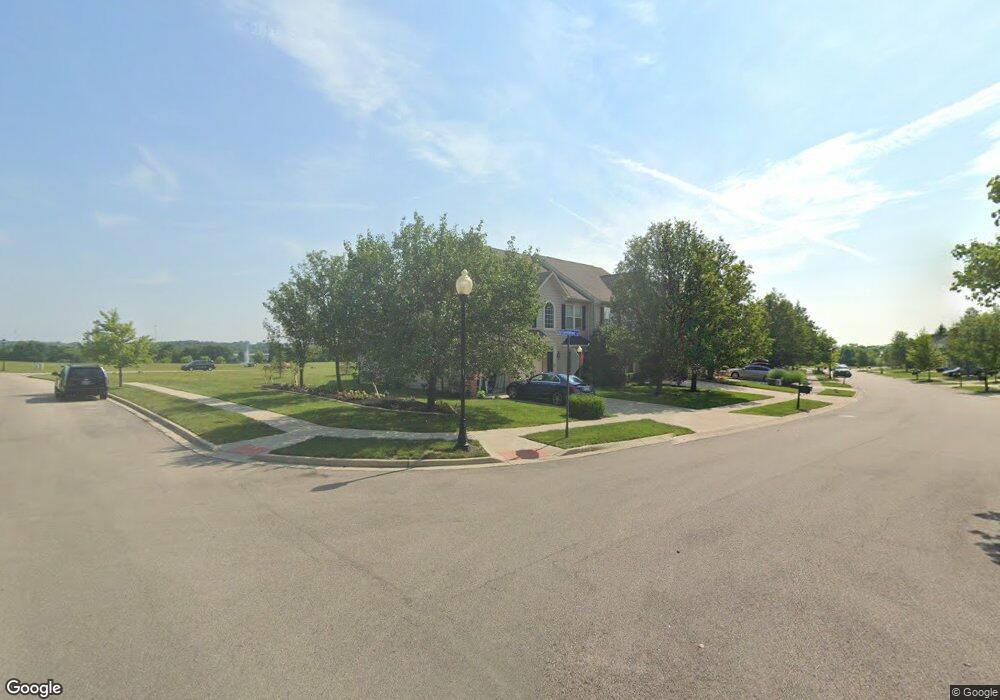
4101 Tangletree Ct Dayton, OH 45414
Estimated Value: $252,913 - $331,000
3
Beds
3
Baths
2,004
Sq Ft
$143/Sq Ft
Est. Value
About This Home
This home is located at 4101 Tangletree Ct, Dayton, OH 45414 and is currently estimated at $285,728, approximately $142 per square foot. 4101 Tangletree Ct is a home located in Montgomery County with nearby schools including Smith Middle School, Demmitt Elementary School, and Butler High School.
Ownership History
Date
Name
Owned For
Owner Type
Purchase Details
Closed on
Jun 6, 2016
Sold by
Pmtd Real Estate Llc
Bought by
Butler Charlotte D
Current Estimated Value
Home Financials for this Owner
Home Financials are based on the most recent Mortgage that was taken out on this home.
Original Mortgage
$152,093
Interest Rate
3.37%
Mortgage Type
FHA
Purchase Details
Closed on
Jun 24, 2015
Sold by
Bostwick Michael D and Bostwick Pamela K
Bought by
Federal National Mortgage Association
Purchase Details
Closed on
Jun 30, 2005
Sold by
Nvr Inc
Bought by
Bostwick Michael D and Bostwick Pamela K
Home Financials for this Owner
Home Financials are based on the most recent Mortgage that was taken out on this home.
Original Mortgage
$163,992
Interest Rate
6.25%
Mortgage Type
Fannie Mae Freddie Mac
Create a Home Valuation Report for This Property
The Home Valuation Report is an in-depth analysis detailing your home's value as well as a comparison with similar homes in the area
Home Values in the Area
Average Home Value in this Area
Purchase History
| Date | Buyer | Sale Price | Title Company |
|---|---|---|---|
| Butler Charlotte D | $154,900 | None Available | |
| Federal National Mortgage Association | -- | Attorney | |
| Bostwick Michael D | $205,000 | -- |
Source: Public Records
Mortgage History
| Date | Status | Borrower | Loan Amount |
|---|---|---|---|
| Previous Owner | Butler Charlotte D | $152,093 | |
| Previous Owner | Bostwick Michael D | $163,992 |
Source: Public Records
Tax History
| Year | Tax Paid | Tax Assessment Tax Assessment Total Assessment is a certain percentage of the fair market value that is determined by local assessors to be the total taxable value of land and additions on the property. | Land | Improvement |
|---|---|---|---|---|
| 2025 | $3,472 | $7,140 | $7,140 | -- |
| 2024 | $4,383 | $7,140 | $7,140 | -- |
| 2023 | $4,383 | $7,140 | $7,140 | $0 |
| 2022 | $4,152 | $44,562 | $2,940 | $41,622 |
| 2021 | $4,143 | $44,562 | $2,940 | $41,622 |
| 2020 | $4,047 | $44,562 | $2,940 | $41,622 |
| 2019 | $4,421 | $44,562 | $2,940 | $41,622 |
| 2018 | $4,444 | $44,562 | $2,940 | $41,622 |
| 2017 | $4,419 | $44,562 | $2,940 | $41,622 |
| 2016 | $4,272 | $40,779 | $2,940 | $37,839 |
| 2015 | $4,375 | $40,779 | $2,940 | $37,839 |
| 2014 | $4,375 | $7,140 | $7,140 | $0 |
| 2012 | -- | $7,140 | $7,140 | $0 |
Source: Public Records
Map
Nearby Homes
- 4114 Tangletree Ct
- 7725 Rockwell Dr
- 664 Deerhurst Dr
- 668 Deerhurst Dr
- 710 Deerhurst Dr
- 1715 Birnam Wood Ct
- 3600 Little York Rd
- 76 Farrell Rd
- 1727 Ashworth Dr
- 416 Bent Twig Dr
- 7580 Turtle Creek Dr
- 7543 Abraham Ct
- 246 Crest Hill Ave
- 3320 Benchwood Rd
- 2501 Harrow Ct
- 6513 Walnut Ridge Rd
- 7531 Turtleback Dr
- 3280 Benchwood Rd
- 1025 Helke Rd
- 1025 Ronald St
- 4107 Tangletree Ct
- 4113 Tangletree Ct
- 4119 Tangletree Ct
- 4125 Tangletree Ct
- 4100 Tangletree Ct
- 4106 Tangletree Ct
- 0 Singing Ridge Blvd
- 4131 Tangletree Ct
- 4110 Tangletree Ct
- 4120 Tangletree Ct
- 4137 Tangletree Ct
- 4130 Tangletree Ct
- 4143 Tangletree Ct
- 4136 Tangletree Ct
- 4149 Tangletree Ct
- 15.500ac Singing Circle Dr
- 4140 Tangletree Ct
- 4155 Tangletree Ct
- 0 Singing Circle Dr Unit 740282
- 0 Singing Circle Dr Unit 713865
Your Personal Tour Guide
Ask me questions while you tour the home.