Estimated Value: $439,000 - $481,000
3
Beds
2
Baths
1,610
Sq Ft
$289/Sq Ft
Est. Value
About This Home
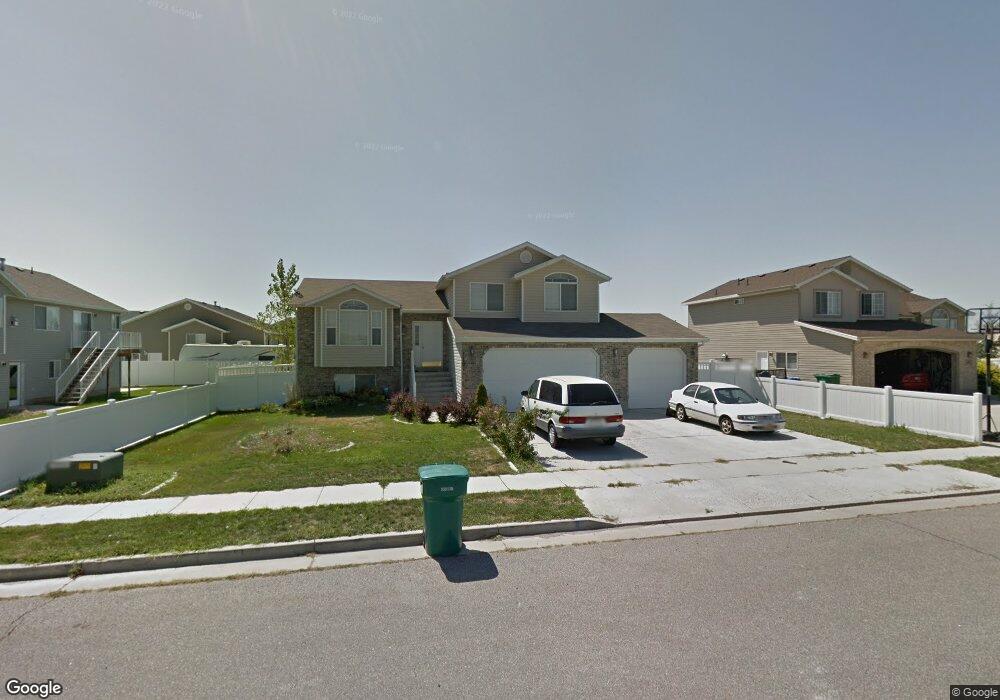
This home is located at 4101 W 4600 S Unit 45, Roy, UT 84067 and is currently estimated at $465,154, approximately $288 per square foot. 4101 W 4600 S Unit 45 is a home located in Weber County with nearby schools including West Haven School, Sand Ridge Junior High School, and Roy High School.
Ownership History
Date
Name
Owned For
Owner Type
Purchase Details
Closed on
Jul 26, 2006
Sold by
Pellertier Glenn R
Bought by
Hernandez Jesie and Hernandez Irma
Current Estimated Value
Purchase Details
Closed on
Jul 25, 2006
Sold by
Pelletier Jennifer L
Bought by
Hernandez Jesie and Hernandez Irma
Purchase Details
Closed on
Jun 5, 2002
Sold by
Mike Schultz Construction Inc
Bought by
Pelletier Glenn R and Pelletier Jennifer L
Home Financials for this Owner
Home Financials are based on the most recent Mortgage that was taken out on this home.
Original Mortgage
$152,898
Interest Rate
6.83%
Mortgage Type
VA
Purchase Details
Closed on
Oct 26, 2001
Sold by
Tiffany Development Lc
Bought by
Mike Schultz Construction
Home Financials for this Owner
Home Financials are based on the most recent Mortgage that was taken out on this home.
Original Mortgage
$112,425
Interest Rate
6.87%
Create a Home Valuation Report for This Property
The Home Valuation Report is an in-depth analysis detailing your home's value as well as a comparison with similar homes in the area
Home Values in the Area
Average Home Value in this Area
Purchase History
| Date | Buyer | Sale Price | Title Company |
|---|---|---|---|
| Hernandez Jesie | -- | First American Title | |
| Hernandez Jesie | -- | First American Title | |
| Pelletier Glenn R | -- | -- | |
| Mike Schultz Construction | -- | Founders Title Co |
Source: Public Records
Mortgage History
| Date | Status | Borrower | Loan Amount |
|---|---|---|---|
| Previous Owner | Pelletier Glenn R | $152,898 | |
| Previous Owner | Mike Schultz Construction | $112,425 |
Source: Public Records
Tax History Compared to Growth
Tax History
| Year | Tax Paid | Tax Assessment Tax Assessment Total Assessment is a certain percentage of the fair market value that is determined by local assessors to be the total taxable value of land and additions on the property. | Land | Improvement |
|---|---|---|---|---|
| 2025 | $2,730 | $448,775 | $130,015 | $318,760 |
| 2024 | $2,632 | $441,000 | $130,015 | $310,985 |
| 2023 | $2,479 | $416,000 | $124,980 | $291,020 |
| 2022 | $2,552 | $442,000 | $110,001 | $331,999 |
| 2021 | $2,108 | $335,000 | $79,963 | $255,037 |
| 2020 | $2,125 | $313,000 | $79,963 | $233,037 |
| 2019 | $1,960 | $270,000 | $49,906 | $220,094 |
| 2018 | $1,893 | $246,000 | $42,041 | $203,959 |
| 2017 | $1,774 | $216,000 | $42,041 | $173,959 |
| 2016 | $1,724 | $113,442 | $21,944 | $91,498 |
| 2015 | $1,488 | $99,388 | $21,944 | $77,444 |
| 2014 | $1,500 | $99,241 | $19,237 | $80,004 |
Source: Public Records
Map
Nearby Homes
- 4094 W 4700 S
- 4097 W 4750 S
- 4024 W 4650 S
- 4106 W 4875 S
- 4756 S 4300 W
- 4141 W 4875 S
- 4890 S 4075 W
- 4990 S 4075 W
- 4021 W 5000 S
- 5013 S 4150 W
- 4218 W 5050 S
- 3692 W 4625 S
- 3669 W 4625 S
- 3671 W 4700 S
- 3820 Foxglen Dr
- 3652 W 4625 S
- 3632 W 4650 S
- 5116 S 4300 W
- 3627 W 4650 S
- Villages Townhome Plan at Green Farm - Villages
- 4101 W 4600 S
- 4607 S 4075 W
- 4105 W 4600 S
- 4105 W 4600 S Unit 44
- 4619 S 4075 W
- 4619 S 4075 W Unit 47
- 4082 W 4650 S
- 4082 W 4650 S Unit 49
- 4092 W 4600 S
- 4092 W 4600 S Unit 40
- 4109 W 4600 S
- 4109 W 4600 S Unit 43
- 4102 W 4600 S
- 4090 W 4650 S
- 4090 W 4650 S Unit 50
- 4076 W 4650 S
- 4084 W 4600 S
- 4084 W 4600 S Unit 39
- 4108 W 4600 S
- 4108 W 4600 S Unit 42