Estimated Value: $256,267 - $299,000
2
Beds
1
Bath
1,218
Sq Ft
$224/Sq Ft
Est. Value
About This Home
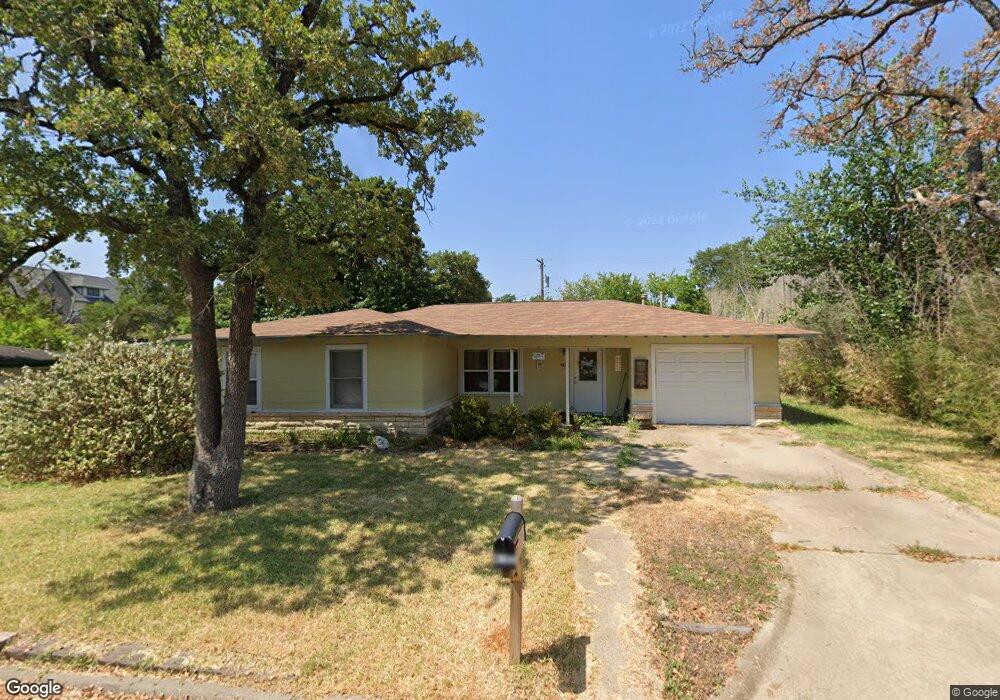
This home is located at 4102 Aspen St, Bryan, TX 77801 and is currently estimated at $272,567, approximately $223 per square foot. 4102 Aspen St is a home located in Brazos County with nearby schools including Crockett Elementary School, Jane Long Middle School, and Bryan High School.
Ownership History
Date
Name
Owned For
Owner Type
Purchase Details
Closed on
Oct 22, 2009
Sold by
Kasamali Shamsuddin and Rajan Fateh
Bought by
Mallard George K and Mallard Ann O
Current Estimated Value
Home Financials for this Owner
Home Financials are based on the most recent Mortgage that was taken out on this home.
Original Mortgage
$83,200
Interest Rate
5.14%
Mortgage Type
New Conventional
Purchase Details
Closed on
Sep 16, 2009
Sold by
Kasamali Shamsuddin
Bought by
Rajan Fateh
Home Financials for this Owner
Home Financials are based on the most recent Mortgage that was taken out on this home.
Original Mortgage
$83,200
Interest Rate
5.14%
Mortgage Type
New Conventional
Purchase Details
Closed on
Jul 7, 2009
Sold by
Choudhry Mohammad G
Bought by
Kasamali Shamsuddin
Purchase Details
Closed on
Jun 9, 2008
Sold by
Jones Ted D and Jones Barbara
Bought by
Choudhry Mohammad G
Create a Home Valuation Report for This Property
The Home Valuation Report is an in-depth analysis detailing your home's value as well as a comparison with similar homes in the area
Home Values in the Area
Average Home Value in this Area
Purchase History
| Date | Buyer | Sale Price | Title Company |
|---|---|---|---|
| Mallard George K | -- | Aggieland Title Company | |
| Rajan Fateh | -- | None Available | |
| Kasamali Shamsuddin | $90,000 | None Available | |
| Choudhry Mohammad G | -- | University Title Company |
Source: Public Records
Mortgage History
| Date | Status | Borrower | Loan Amount |
|---|---|---|---|
| Closed | Mallard George K | $83,200 |
Source: Public Records
Tax History Compared to Growth
Tax History
| Year | Tax Paid | Tax Assessment Tax Assessment Total Assessment is a certain percentage of the fair market value that is determined by local assessors to be the total taxable value of land and additions on the property. | Land | Improvement |
|---|---|---|---|---|
| 2025 | $4,201 | $236,309 | $201,250 | $35,059 |
| 2024 | $4,201 | $220,720 | $191,013 | $29,707 |
| 2023 | $4,201 | $211,883 | $173,075 | $38,808 |
| 2022 | $4,611 | $210,274 | $173,075 | $37,199 |
| 2021 | $4,473 | $189,813 | $179,375 | $10,438 |
| 2020 | $4,558 | $190,126 | $179,375 | $10,751 |
| 2019 | $4,642 | $189,070 | $179,380 | $9,690 |
| 2018 | $4,642 | $189,070 | $179,380 | $9,690 |
| 2017 | $3,677 | $149,170 | $139,480 | $9,690 |
| 2016 | $3,749 | $152,070 | $119,260 | $32,810 |
| 2015 | $3,427 | $150,760 | $96,250 | $54,510 |
| 2014 | $3,427 | $142,510 | $87,500 | $55,010 |
Source: Public Records
Map
Nearby Homes
- 4101 College Main St
- 506 Clay St Unit COB
- 4004 Oaklawn St
- 3802 College Main St Unit 13
- 4441 Old College Rd Unit 7202
- 3907 Nagle St Unit COB
- 4200 Milam St
- 100 Fleetwood St
- 500 1st St
- 400 Nagle St Unit 203
- 108 College View Dr
- 107 North Ave E
- 3703 S College Ave
- 142 Watson St
- 304 Dunn St
- 3803 Ridgewood St
- 3404 Cavitt Ave
- 600 North Ave E
- 114 Lynn Dr
- 403 Sulphur Springs Rd
- 4100 Aspen St
- 4100 Aspen St
- 4100 Aspen St Unit A
- 4100 Aspen St Unit C
- 4100 Aspen St Unit D
- 4100 Aspen St Unit B
- 4108 Aspen St
- 4014 Aspen St
- 4105 College Main St
- 4010 Aspen St
- 4101 Aspen St
- 4006 Aspen St
- 4009 College Main St
- 4007 Aspen St
- 4013 Aspen St Unit 114
- 4013 Aspen St Unit 124
- 4200 Aspen St
- 4201 Aspen St
- 4007 College Main St
- 612 Clay St