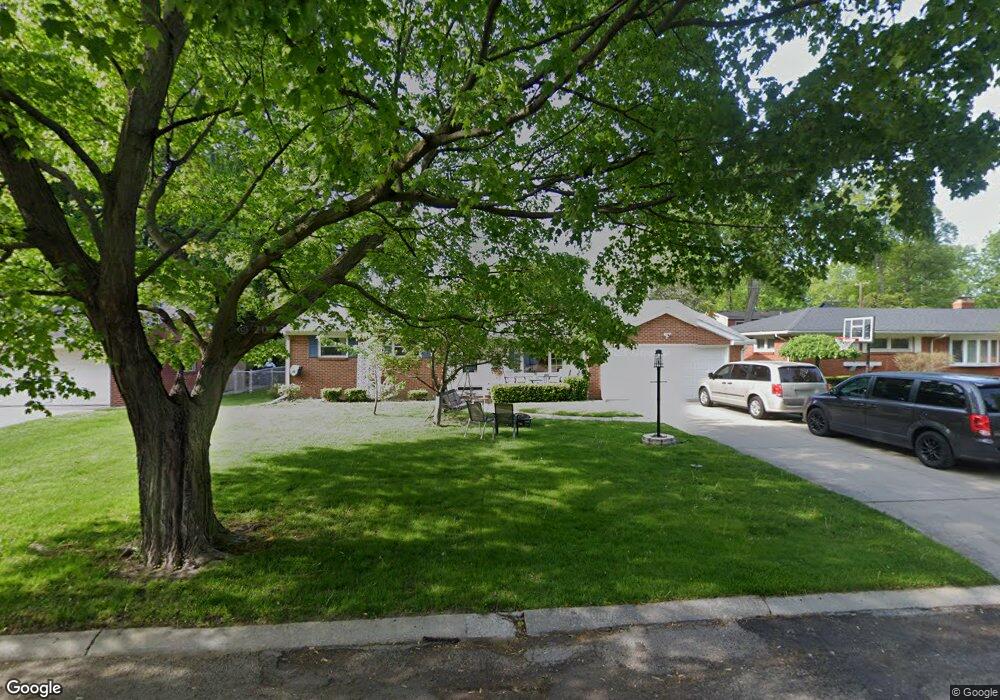
4102 Briarcrest Rd Toledo, OH 43623
Franklin Park NeighborhoodEstimated Value: $212,770 - $240,000
3
Beds
2
Baths
1,544
Sq Ft
$148/Sq Ft
Est. Value
About This Home
This home is located at 4102 Briarcrest Rd, Toledo, OH 43623 and is currently estimated at $228,443, approximately $147 per square foot. 4102 Briarcrest Rd is a home located in Lucas County with nearby schools including Monac Elementary School, Jefferson Junior High School, and Washington Junior High School.
Ownership History
Date
Name
Owned For
Owner Type
Purchase Details
Closed on
Jul 3, 2017
Sold by
Janowiecki Paul
Bought by
Hughes Kevin L and Hughes Lisa D
Current Estimated Value
Home Financials for this Owner
Home Financials are based on the most recent Mortgage that was taken out on this home.
Original Mortgage
$119,700
Interest Rate
3.95%
Mortgage Type
New Conventional
Purchase Details
Closed on
Dec 22, 2016
Sold by
Janowiecki Norman J
Bought by
Jasnowieski Paul and Jasnowieski Residence Trust
Purchase Details
Closed on
Sep 15, 1998
Sold by
Schneider John N
Bought by
Janowiecki Norman J and Janowiecki Irene H
Home Financials for this Owner
Home Financials are based on the most recent Mortgage that was taken out on this home.
Original Mortgage
$25,000
Interest Rate
6.98%
Purchase Details
Closed on
Apr 11, 1988
Sold by
Huebner Roy O and Huebner Virginia A
Create a Home Valuation Report for This Property
The Home Valuation Report is an in-depth analysis detailing your home's value as well as a comparison with similar homes in the area
Home Values in the Area
Average Home Value in this Area
Purchase History
| Date | Buyer | Sale Price | Title Company |
|---|---|---|---|
| Hughes Kevin L | $126,000 | None Available | |
| Jasnowieski Paul | -- | None Available | |
| Janowiecki Norman J | $128,900 | -- | |
| -- | $93,500 | -- |
Source: Public Records
Mortgage History
| Date | Status | Borrower | Loan Amount |
|---|---|---|---|
| Previous Owner | Hughes Kevin L | $119,700 | |
| Previous Owner | Janowiecki Norman J | $25,000 |
Source: Public Records
Tax History Compared to Growth
Tax History
| Year | Tax Paid | Tax Assessment Tax Assessment Total Assessment is a certain percentage of the fair market value that is determined by local assessors to be the total taxable value of land and additions on the property. | Land | Improvement |
|---|---|---|---|---|
| 2024 | $1,653 | $52,955 | $8,190 | $44,765 |
| 2023 | $3,013 | $41,055 | $6,790 | $34,265 |
| 2022 | $3,007 | $41,055 | $6,790 | $34,265 |
| 2021 | $3,062 | $41,055 | $6,790 | $34,265 |
| 2020 | $3,377 | $39,235 | $5,320 | $33,915 |
| 2019 | $3,281 | $39,235 | $5,320 | $33,915 |
| 2018 | $2,706 | $39,235 | $5,320 | $33,915 |
| 2017 | $2,403 | $38,360 | $5,215 | $33,145 |
| 2016 | $2,407 | $109,600 | $14,900 | $94,700 |
| 2015 | $2,401 | $109,600 | $14,900 | $94,700 |
| 2014 | $2,018 | $38,370 | $5,220 | $33,150 |
| 2013 | $2,018 | $38,370 | $5,220 | $33,150 |
Source: Public Records
Map
Nearby Homes
- 4122 Briarcrest Rd
- 5104 Tillimon Trail
- 5344 Talmadge Rd
- 5404 Harschel Dr
- 4714 Naomi Dr
- 4504 Sulgrave Dr
- 5415 Fenwick Dr
- 5565 Steffens Ave
- 4647 Harvest Ln
- 5447 Harvest Ln
- 5563 Harschel Dr
- 3527 Cedardale Ct
- 5523 Fenwick Dr
- 3513 Cedardale Ct
- 4647 Hannaford Dr
- 5240 Rambo Ln
- 5539 Ginger Tree Ln
- 4420 Rose Garden Dr
- 4943 Flanders Rd
- 4733 High Oaks Blvd
- 4110 Briarcrest Rd
- 4050 Briarcrest Rd
- 4057 Pinecrest Dr
- 4051 Pinecrest Dr
- 4063 Pinecrest Dr
- 4045 Pinecrest Dr
- 4055 Briarcrest Rd
- 4043 Briarcrest Rd
- 4109 Briarcrest Rd
- 4039 Pinecrest Dr
- 4128 Briarcrest Rd
- 4111 Briarcrest Rd
- 4030 Briarcrest Rd
- 5137 Bridlington Dr
- 4002 Gilhouse Rd
- 4113 Briarcrest Rd
- 4033 Pinecrest Dr
- 5140 Bridlington Dr
- 4048 Gilhouse Rd
- 5124 Avonhurst Rd