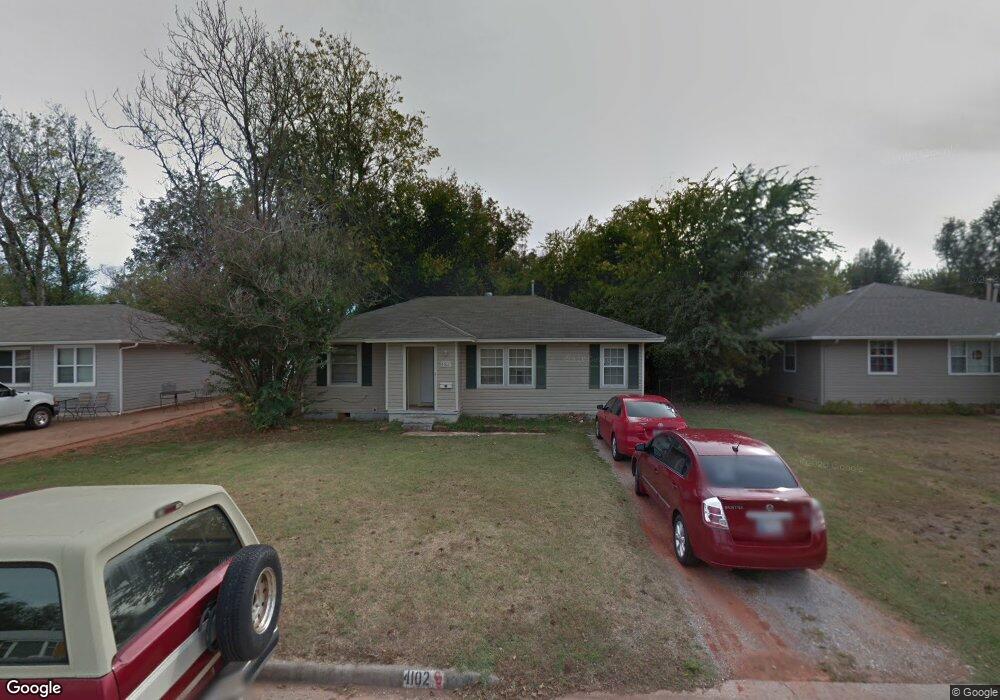
4102 SE 11th St Oklahoma City, OK 73115
Estimated Value: $72,000 - $116,571
3
Beds
1
Bath
720
Sq Ft
$132/Sq Ft
Est. Value
About This Home
This home is located at 4102 SE 11th St, Oklahoma City, OK 73115 and is currently estimated at $95,393, approximately $132 per square foot. 4102 SE 11th St is a home located in Oklahoma County with nearby schools including Del City Elementary School, Del City High School, and Christian Heritage Academy.
Ownership History
Date
Name
Owned For
Owner Type
Purchase Details
Closed on
Feb 14, 2020
Sold by
Square 1 Enterprises Inc
Bought by
Unity Homes Llc
Current Estimated Value
Purchase Details
Closed on
Nov 15, 2019
Sold by
Beloncik Jeffrey and Beloncik Andrea
Bought by
Square 1 Enterprises Inc
Purchase Details
Closed on
Jun 7, 2006
Sold by
Cassil Dan and Cassil Mary Susan
Bought by
Beloncik Jeffrey and Beloncik Andrea
Purchase Details
Closed on
May 5, 2006
Sold by
Harmeyer Robert C and Harmeyer Christina A
Bought by
Cassil Dan
Purchase Details
Closed on
Apr 14, 2000
Sold by
Colwill Daryl and Colwill Carolyn
Bought by
Harmeyer Robert C and Kiespert Christina A
Home Financials for this Owner
Home Financials are based on the most recent Mortgage that was taken out on this home.
Original Mortgage
$35,589
Interest Rate
8.24%
Purchase Details
Closed on
Oct 21, 1999
Sold by
Moore Wendall C and Moore Dion L
Bought by
Colwill Daryl and Colwill Carolyn
Create a Home Valuation Report for This Property
The Home Valuation Report is an in-depth analysis detailing your home's value as well as a comparison with similar homes in the area
Home Values in the Area
Average Home Value in this Area
Purchase History
| Date | Buyer | Sale Price | Title Company |
|---|---|---|---|
| Unity Homes Llc | $48,000 | Trustmark Ttl Acquisition Gr | |
| Square 1 Enterprises Inc | $40,000 | None Available | |
| Beloncik Jeffrey | -- | None Available | |
| Cassil Dan | $26,000 | None Available | |
| Harmeyer Robert C | $36,000 | Stewart Abstract & Title | |
| Colwill Daryl | $25,000 | -- |
Source: Public Records
Mortgage History
| Date | Status | Borrower | Loan Amount |
|---|---|---|---|
| Previous Owner | Harmeyer Robert C | $35,589 |
Source: Public Records
Tax History Compared to Growth
Tax History
| Year | Tax Paid | Tax Assessment Tax Assessment Total Assessment is a certain percentage of the fair market value that is determined by local assessors to be the total taxable value of land and additions on the property. | Land | Improvement |
|---|---|---|---|---|
| 2024 | $636 | $5,941 | $1,363 | $4,578 |
| 2023 | $636 | $5,659 | $1,080 | $4,579 |
| 2022 | $597 | $5,390 | $1,407 | $3,983 |
| 2021 | $618 | $5,390 | $1,407 | $3,983 |
| 2020 | $622 | $5,280 | $1,407 | $3,873 |
| 2019 | $600 | $5,255 | $1,280 | $3,975 |
| 2018 | $580 | $5,005 | $0 | $0 |
| 2017 | $579 | $4,966 | $1,303 | $3,663 |
| 2016 | $567 | $4,729 | $1,313 | $3,416 |
| 2015 | $576 | $4,778 | $1,108 | $3,670 |
| 2014 | $564 | $4,690 | $1,108 | $3,582 |
Source: Public Records
Map
Nearby Homes
- 4108 SE 10th St
- 4109 SE 14th St
- 4316 SE 13th St
- 4345 Woodedge Dr
- 3921 SE 11th St
- 3918 SE 12th St
- 3917 SE 12th St
- 3924 SE 14th St
- 1645 Lariet Ln
- 3919 SE 10th Place
- 1600 Elm Dr
- 1608 Hanna Dr
- 3902 SE 14th St
- 3336 Longridge Rd
- 720 Del Haven Dr
- 1137 Mallard Dr
- 3316 Beechwood Dr
- 1001 Shalimar Dr
- 1524 Hampton Dr
- 1820 Cherry Ln
- 4100 SE 11th St
- 4104 SE 11th St
- 4106 SE 11th St
- 4103 SE 12th St
- 4101 SE 12th St
- 4105 SE 12th St
- 4020 SE 11th St
- 4108 SE 11th St
- 4107 SE 12th St
- 4103 SE 11th St
- 4105 SE 11th St
- 4101 SE 11th St
- 4021 SE 12th St
- 4018 SE 11th St
- 4107 SE 11th St
- 4109 SE 12th St
- 4021 SE 11th St
- 4109 SE 11th St
- 4019 SE 12th St
- 4016 SE 11th St