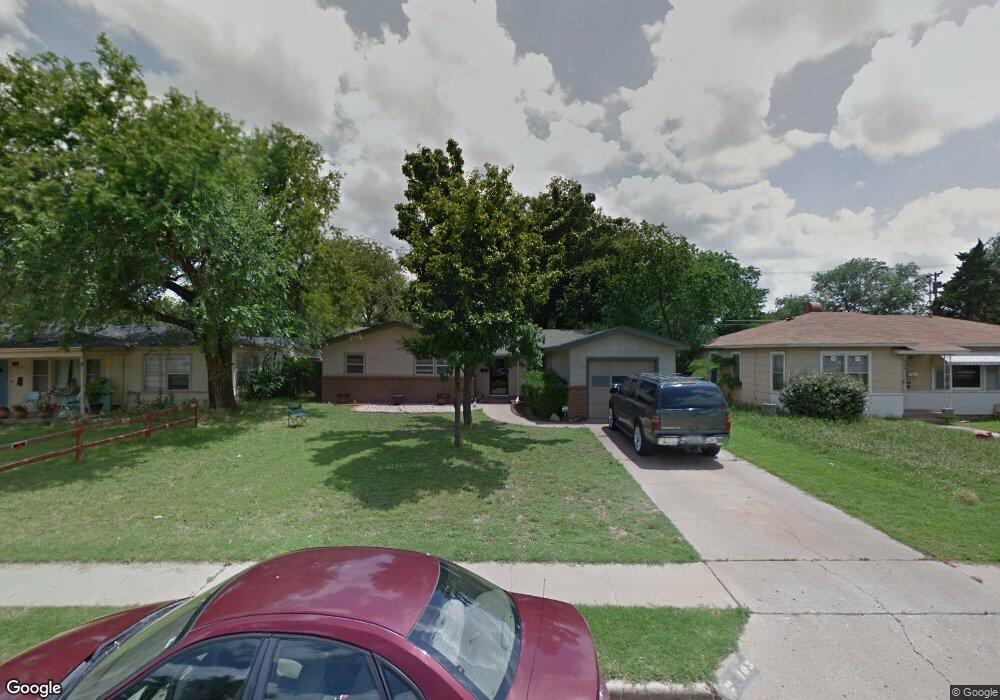
4103 32nd St Lubbock, TX 79410
Maxey Park NeighborhoodEstimated Value: $138,000 - $153,304
3
Beds
2
Baths
1,194
Sq Ft
$125/Sq Ft
Est. Value
About This Home
This home is located at 4103 32nd St, Lubbock, TX 79410 and is currently estimated at $149,076, approximately $124 per square foot. 4103 32nd St is a home located in Lubbock County with nearby schools including Overton Elementary School, Commander William C. McCool Academy, and Mackenzie Middle School.
Ownership History
Date
Name
Owned For
Owner Type
Purchase Details
Closed on
Sep 17, 2018
Sold by
King Landon D
Bought by
Csk Properties Ltd
Current Estimated Value
Purchase Details
Closed on
Mar 16, 2005
Sold by
Mcdaniel Patsy Jo
Bought by
King Landon D
Purchase Details
Closed on
Jan 10, 1992
Sold by
Pollard Claude Alvin
Bought by
King Landon D
Purchase Details
Closed on
Sep 13, 1991
Bought by
King Landon D
Create a Home Valuation Report for This Property
The Home Valuation Report is an in-depth analysis detailing your home's value as well as a comparison with similar homes in the area
Home Values in the Area
Average Home Value in this Area
Purchase History
| Date | Buyer | Sale Price | Title Company |
|---|---|---|---|
| Csk Properties Ltd | -- | Service Title | |
| King Landon D | -- | -- | |
| King Landon D | -- | -- | |
| King Landon D | -- | -- |
Source: Public Records
Tax History Compared to Growth
Tax History
| Year | Tax Paid | Tax Assessment Tax Assessment Total Assessment is a certain percentage of the fair market value that is determined by local assessors to be the total taxable value of land and additions on the property. | Land | Improvement |
|---|---|---|---|---|
| 2025 | $2,758 | $151,894 | $23,500 | $128,394 |
| 2024 | $2,758 | $151,894 | $23,500 | $128,394 |
| 2023 | $2,524 | $135,773 | $10,980 | $124,793 |
| 2022 | $2,666 | $131,690 | $10,980 | $120,710 |
| 2021 | $1,950 | $91,029 | $10,980 | $80,049 |
| 2020 | $1,960 | $90,117 | $10,980 | $79,137 |
| 2019 | $2,035 | $90,648 | $10,980 | $79,668 |
| 2018 | $2,124 | $94,500 | $10,980 | $83,520 |
| 2017 | $1,879 | $83,480 | $10,980 | $72,500 |
| 2016 | $1,827 | $81,161 | $10,980 | $70,181 |
| 2015 | $1,659 | $75,577 | $10,980 | $64,597 |
| 2014 | $1,659 | $74,611 | $5,400 | $69,211 |
Source: Public Records
Map
Nearby Homes