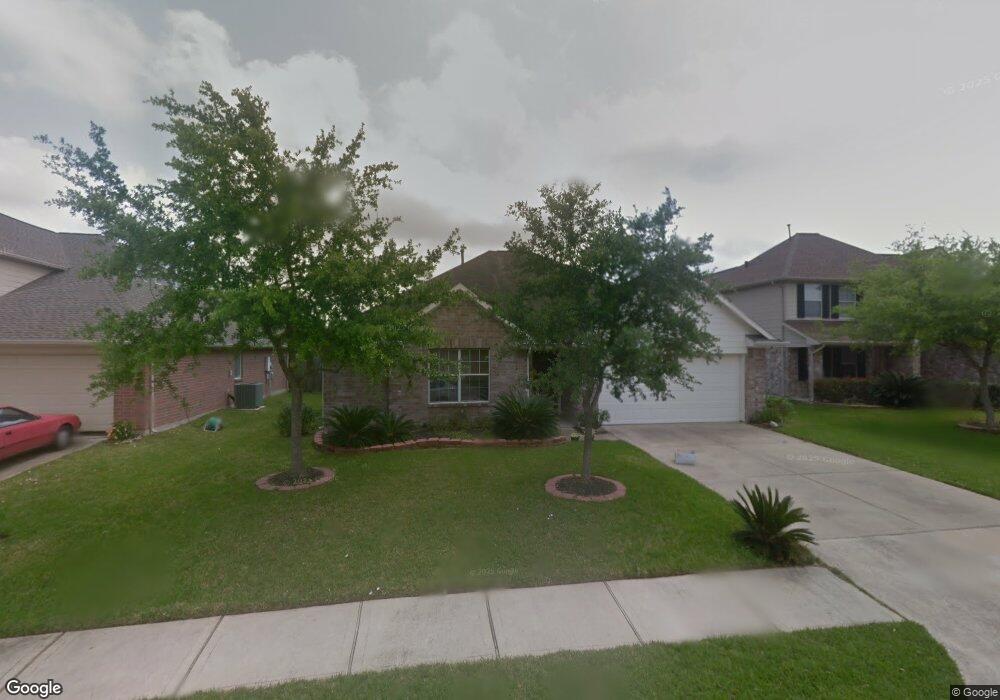
4103 Caneshaw Dr Pearland, TX 77584
Estimated Value: $296,083 - $337,000
--
Bed
1
Bath
1,886
Sq Ft
$168/Sq Ft
Est. Value
About This Home
This home is located at 4103 Caneshaw Dr, Pearland, TX 77584 and is currently estimated at $316,271, approximately $167 per square foot. 4103 Caneshaw Dr is a home located in Brazoria County with nearby schools including Magnolia Elementary School, Pearland Junior High School South, and Sam Jamison Middle School.
Ownership History
Date
Name
Owned For
Owner Type
Purchase Details
Closed on
Apr 23, 2015
Sold by
Selby Mark R
Bought by
Selby Mark R and Selby Megan A
Current Estimated Value
Home Financials for this Owner
Home Financials are based on the most recent Mortgage that was taken out on this home.
Original Mortgage
$87,000
Outstanding Balance
$32,057
Interest Rate
3.84%
Mortgage Type
New Conventional
Estimated Equity
$284,214
Purchase Details
Closed on
Jul 14, 2006
Sold by
Matchett Lori and Foster Mark
Bought by
Selby Mark R
Home Financials for this Owner
Home Financials are based on the most recent Mortgage that was taken out on this home.
Original Mortgage
$142,871
Outstanding Balance
$84,678
Interest Rate
6.62%
Mortgage Type
FHA
Estimated Equity
$231,593
Purchase Details
Closed on
Jul 25, 2003
Sold by
Lennar Homes Of Texas Inc
Bought by
Foster Mark and Matchett Lori
Home Financials for this Owner
Home Financials are based on the most recent Mortgage that was taken out on this home.
Original Mortgage
$136,350
Interest Rate
5.24%
Mortgage Type
FHA
Create a Home Valuation Report for This Property
The Home Valuation Report is an in-depth analysis detailing your home's value as well as a comparison with similar homes in the area
Home Values in the Area
Average Home Value in this Area
Purchase History
| Date | Buyer | Sale Price | Title Company |
|---|---|---|---|
| Selby Mark R | -- | First American Title Ins Co | |
| Selby Mark R | -- | First American Title | |
| Foster Mark | -- | North American Title Co |
Source: Public Records
Mortgage History
| Date | Status | Borrower | Loan Amount |
|---|---|---|---|
| Open | Selby Mark R | $87,000 | |
| Open | Selby Mark R | $142,871 | |
| Previous Owner | Foster Mark | $136,350 |
Source: Public Records
Tax History Compared to Growth
Tax History
| Year | Tax Paid | Tax Assessment Tax Assessment Total Assessment is a certain percentage of the fair market value that is determined by local assessors to be the total taxable value of land and additions on the property. | Land | Improvement |
|---|---|---|---|---|
| 2025 | $4,383 | $282,230 | $23,560 | $258,670 |
| 2023 | $4,383 | $240,350 | $22,870 | $290,190 |
| 2022 | $5,975 | $218,500 | $22,870 | $195,630 |
| 2021 | $5,860 | $203,000 | $22,870 | $180,130 |
| 2020 | $5,768 | $193,000 | $22,870 | $170,130 |
| 2019 | $5,262 | $172,040 | $22,870 | $149,170 |
| 2018 | $4,972 | $162,120 | $22,870 | $139,250 |
| 2017 | $5,026 | $162,120 | $22,870 | $139,250 |
| 2016 | $5,368 | $175,910 | $22,870 | $153,040 |
| 2014 | -- | $144,740 | $22,870 | $121,870 |
Source: Public Records
Map
Nearby Homes
- 5205 Spring Branch Dr
- 3834 Aubrell Rd
- 5101 Big Spring Dr
- 16622 Mclean Rd
- 16708 N Wayne Ln
- 3911 Spring Garden Dr
- 3730 Aubrell Rd
- 6436 Grace Ln
- 5806 Wilton St
- 4013 Ivywood Dr
- 3902 Basil Ct
- 16719 Mclean Rd
- 3602 Lindhaven Dr
- 3910 Greenwood Dr
- 7206 Williams Rd
- 4015 Cedarwood Dr
- 4009 Ravencrest Ct
- 4806 Chaperel Dr
- 6112 Tomorrow Cir
- 7223 Libby Ln
- 4105 Caneshaw Dr
- 4101 Caneshaw Dr
- 4104 Boulder Dr
- 4106 Boulder Dr
- 4102 Boulder Dr
- 4104 Caneshaw Dr
- 4108 Boulder Dr
- 4106 Caneshaw Dr
- 4102 Caneshaw Dr
- 4109 Caneshaw Dr
- 4108 Caneshaw Dr
- 5405 Caprock Dr
- 4110 Boulder Dr
- 5407 Caprock Dr
- 5403 Caprock Dr
- 5409 Caprock Dr
- 4110 Caneshaw Dr
- 5401 Caprock Dr
- 4111 Caneshaw Dr
- 4103 Tawakon Dr