Estimated Value: $469,789 - $519,000
2
Beds
3
Baths
1,601
Sq Ft
$307/Sq Ft
Est. Value
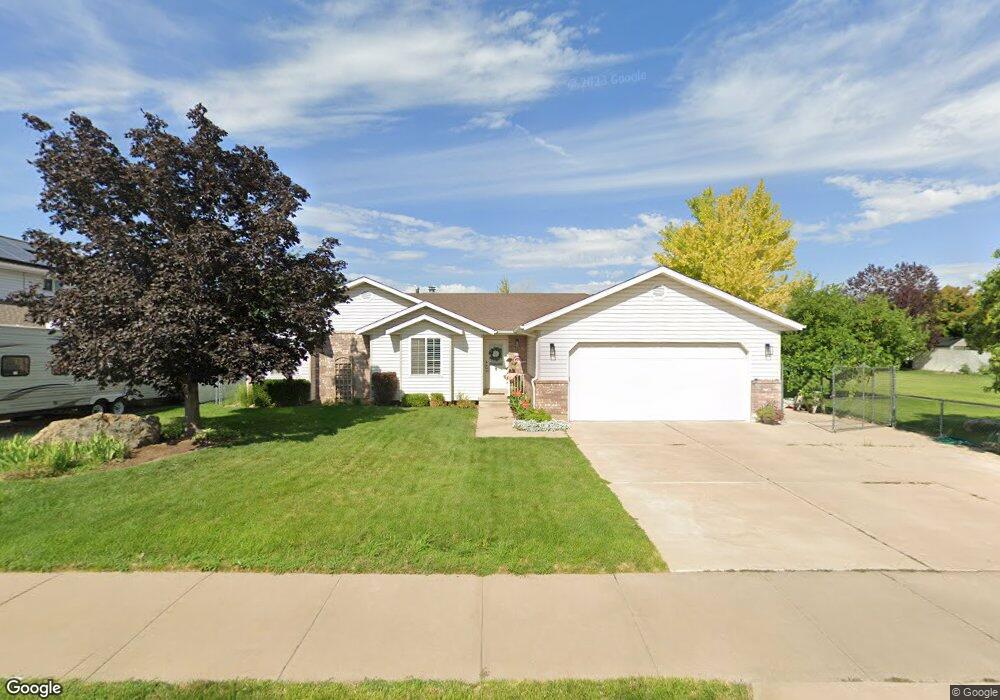
About This Home
This home is located at 4103 S 2175 W, Roy, UT 84067 and is currently estimated at $491,697, approximately $307 per square foot. 4103 S 2175 W is a home located in Weber County with nearby schools including North Park School, Sand Ridge Junior High School, and Roy High School.
Ownership History
Date
Name
Owned For
Owner Type
Purchase Details
Closed on
Apr 22, 2021
Sold by
Mclean Susan S and Smith Scott L
Bought by
Erickson Clinton J and Erickson Paige C
Current Estimated Value
Home Financials for this Owner
Home Financials are based on the most recent Mortgage that was taken out on this home.
Original Mortgage
$351,000
Outstanding Balance
$317,164
Interest Rate
3.05%
Mortgage Type
New Conventional
Estimated Equity
$174,533
Purchase Details
Closed on
Mar 4, 2004
Sold by
Smith Yvonne E
Bought by
The Trust Of Alden B & Yvonne E Smith
Purchase Details
Closed on
Jul 27, 1983
Sold by
Robinson Dewitt
Bought by
High Norma L
Create a Home Valuation Report for This Property
The Home Valuation Report is an in-depth analysis detailing your home's value as well as a comparison with similar homes in the area
Home Values in the Area
Average Home Value in this Area
Purchase History
| Date | Buyer | Sale Price | Title Company |
|---|---|---|---|
| Erickson Clinton J | -- | Us Title Insurance Agency | |
| The Trust Of Alden B & Yvonne E Smith | -- | -- | |
| High Norma L | -- | -- |
Source: Public Records
Mortgage History
| Date | Status | Borrower | Loan Amount |
|---|---|---|---|
| Open | Erickson Clinton J | $351,000 |
Source: Public Records
Tax History Compared to Growth
Tax History
| Year | Tax Paid | Tax Assessment Tax Assessment Total Assessment is a certain percentage of the fair market value that is determined by local assessors to be the total taxable value of land and additions on the property. | Land | Improvement |
|---|---|---|---|---|
| 2025 | $2,956 | $474,742 | $157,303 | $317,439 |
| 2024 | $2,887 | $256,849 | $86,516 | $170,333 |
| 2023 | $2,970 | $266,201 | $86,862 | $179,339 |
| 2022 | $2,854 | $261,800 | $70,604 | $191,196 |
| 2021 | $2,458 | $372,000 | $83,835 | $288,165 |
| 2020 | $2,271 | $315,000 | $83,835 | $231,165 |
| 2019 | $1,093 | $305,000 | $64,076 | $240,924 |
| 2018 | $2,291 | $284,000 | $64,076 | $219,924 |
| 2017 | $1,020 | $249,000 | $63,095 | $185,905 |
| 2016 | $1,969 | $122,306 | $32,562 | $89,744 |
| 2015 | $675 | $112,920 | $32,562 | $80,358 |
| 2014 | $907 | $104,911 | $28,244 | $76,667 |
Source: Public Records
Map
Nearby Homes
- 4073 S 2175 W
- 4110 S 2275 W
- 4205 S 2075 W
- 3965 S 2225 W
- 2070 W 4000 S
- 4164 S 2400 W
- 2096 W 3950 S
- 4220 S 2075 W
- 2050 W 4000 S
- 2015 W 4225 S
- 4328 S 2175 W
- 1959 3985 St S Unit 2
- 3923 S 1975 W Unit 15
- 1910 W 3920 S
- 2263 W 4400 S
- 3860 Midland Dr Unit C10
- 3860 Midland Dr Unit A18
- 3860 Midland Dr Unit B32
- 3854 S 1925 W
- 4118 Westlake Dr