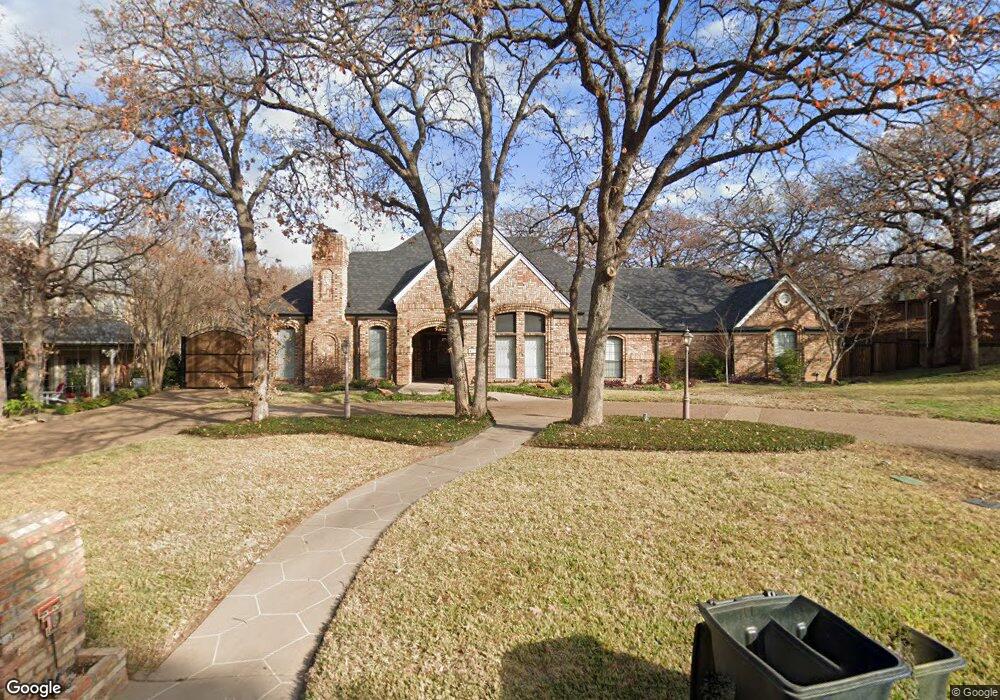
4103 Wood Creek Ct Colleyville, TX 76034
Estimated Value: $897,390 - $965,000
4
Beds
3
Baths
4,088
Sq Ft
$228/Sq Ft
Est. Value
About This Home
This home is located at 4103 Wood Creek Ct, Colleyville, TX 76034 and is currently estimated at $933,598, approximately $228 per square foot. 4103 Wood Creek Ct is a home located in Tarrant County with nearby schools including Bedford Heights Elementary School, Bedford Junior High School, and L.D. Bell High School.
Ownership History
Date
Name
Owned For
Owner Type
Purchase Details
Closed on
May 27, 2016
Sold by
Munn Loren D and Munn Virginia K
Bought by
Rojas Michael Chase and Rojas Emily Suzanne
Current Estimated Value
Home Financials for this Owner
Home Financials are based on the most recent Mortgage that was taken out on this home.
Original Mortgage
$400,000
Outstanding Balance
$318,563
Interest Rate
3.59%
Mortgage Type
Purchase Money Mortgage
Estimated Equity
$615,035
Purchase Details
Closed on
Nov 14, 2008
Sold by
Reames Betty J
Bought by
Munn Loren D and Munn Virginia K
Home Financials for this Owner
Home Financials are based on the most recent Mortgage that was taken out on this home.
Original Mortgage
$265,500
Interest Rate
6.5%
Mortgage Type
Purchase Money Mortgage
Purchase Details
Closed on
Jul 22, 2005
Sold by
Reames William J and Reames Betty J
Bought by
Reames William J and Reames Betty J
Create a Home Valuation Report for This Property
The Home Valuation Report is an in-depth analysis detailing your home's value as well as a comparison with similar homes in the area
Home Values in the Area
Average Home Value in this Area
Purchase History
| Date | Buyer | Sale Price | Title Company |
|---|---|---|---|
| Rojas Michael Chase | -- | Freedom Title Company | |
| Munn Loren D | -- | Capital Title Of Texas | |
| Reames William J | -- | -- |
Source: Public Records
Mortgage History
| Date | Status | Borrower | Loan Amount |
|---|---|---|---|
| Open | Rojas Michael Chase | $400,000 | |
| Previous Owner | Munn Loren D | $265,500 |
Source: Public Records
Tax History Compared to Growth
Tax History
| Year | Tax Paid | Tax Assessment Tax Assessment Total Assessment is a certain percentage of the fair market value that is determined by local assessors to be the total taxable value of land and additions on the property. | Land | Improvement |
|---|---|---|---|---|
| 2025 | $9,874 | $635,507 | $245,950 | $389,557 |
| 2024 | $9,874 | $793,591 | $245,950 | $547,641 |
| 2023 | $12,167 | $767,755 | $245,950 | $521,805 |
| 2022 | $12,840 | $735,444 | $245,950 | $489,494 |
| 2021 | $12,491 | $632,379 | $147,570 | $484,809 |
| 2020 | $11,488 | $543,063 | $147,570 | $395,493 |
| 2019 | $11,638 | $543,063 | $147,570 | $395,493 |
| 2018 | $8,647 | $483,476 | $147,570 | $335,906 |
| 2017 | $10,851 | $475,571 | $80,000 | $395,571 |
| 2016 | $8,887 | $389,491 | $80,000 | $309,491 |
| 2015 | $6,738 | $405,094 | $60,000 | $345,094 |
| 2014 | $6,738 | $344,500 | $50,000 | $294,500 |
Source: Public Records
Map
Nearby Homes
- 1421 Plantation Dr N
- 1303 Crest Dr
- 4600 Stafford Dr
- 3907 Copperwood Ct
- 4002 Copperwood Ct
- 2001 Oak Knoll Dr
- 4516 Dartmoore Ln
- 4105 Inwood Ln
- 3907 Windermere Dr
- 4600 Westbury Dr
- 4812 Carmel Place
- 1136 Wingate Dr
- 3827 Ashbury Ln
- 1916 Renfro Rd
- 1104 Garry Lynne Dr
- 2204 Woodstock Dr
- 4612 Bill Simmons Rd
- 1109 Simpson Terrace
- 4816 Bill Simmons Rd
- 2201 Oak Knoll Ct
- 4101 Wood Creek Ct
- 4105 Wood Creek Ct
- 1410 Plantation Dr N
- 4102 Trail Bend Ct
- 4102 Wood Creek Ct
- 4100 Wood Creek Ct
- 4107 Wood Creek Ct
- 4100 Trail Bend Ct
- 1312 Crest Dr
- 4104 Wood Creek Ct
- 4000 Fair Hill Ct
- 1411 Plantation Dr N
- 1310 Crest Dr
- 4106 Trail Bend Ct
- 4103 Savannah Ct
- 4101 Savannah Ct
- 4001 Fair Hill Ct
- 4105 Savannah Ct
- 4101 Trail Bend Ct
- 4107 Trail Bend Ct