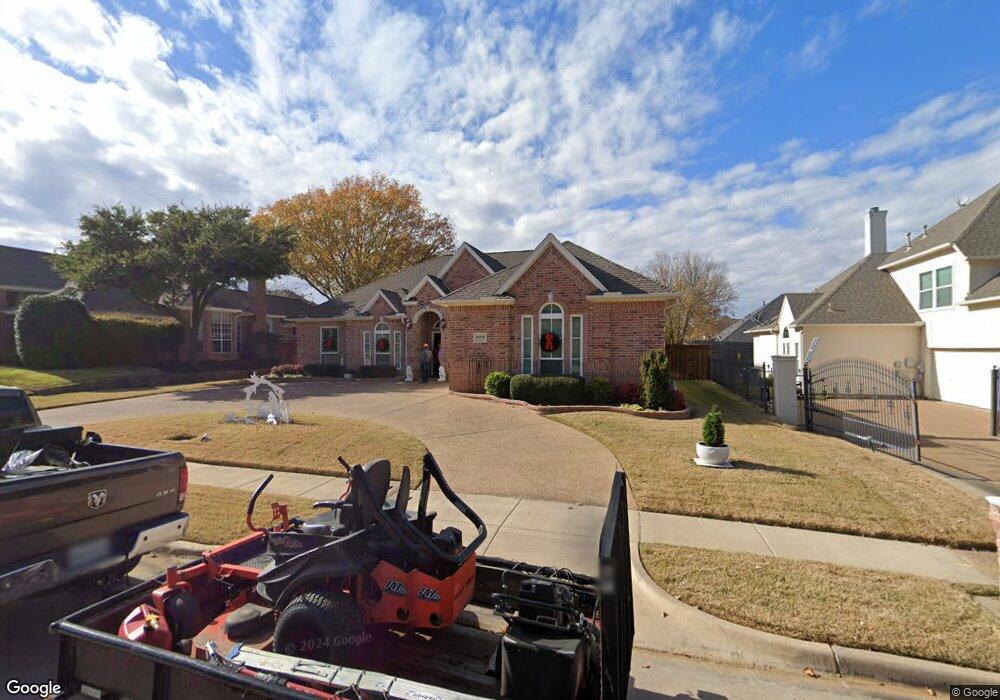
4104 Coachman Ln Colleyville, TX 76034
Estimated Value: $629,529 - $771,000
5
Beds
3
Baths
2,832
Sq Ft
$250/Sq Ft
Est. Value
About This Home
This home is located at 4104 Coachman Ln, Colleyville, TX 76034 and is currently estimated at $709,382, approximately $250 per square foot. 4104 Coachman Ln is a home located in Tarrant County with nearby schools including Bransford Elementary School, Colleyville Middle School, and Grapevine High School.
Ownership History
Date
Name
Owned For
Owner Type
Purchase Details
Closed on
Oct 19, 2023
Sold by
Eaves Bill W and Eaves Janice E
Bought by
Billy And Janice Eaves Trust and Eaves
Current Estimated Value
Purchase Details
Closed on
Sep 29, 2004
Sold by
Eaves Bill W and Eaves Janice E
Bought by
Eaves Billy W and Eaves Janice E
Purchase Details
Closed on
Feb 1, 1996
Sold by
Ambiance Custom Homes Inc
Bought by
Eaves Bill W and Eaves Janice E
Home Financials for this Owner
Home Financials are based on the most recent Mortgage that was taken out on this home.
Original Mortgage
$170,400
Interest Rate
7.19%
Purchase Details
Closed on
May 9, 1995
Sold by
Tls Homes Inc
Bought by
Ambiance Custom Homes Inc
Home Financials for this Owner
Home Financials are based on the most recent Mortgage that was taken out on this home.
Original Mortgage
$180,000
Interest Rate
8.35%
Create a Home Valuation Report for This Property
The Home Valuation Report is an in-depth analysis detailing your home's value as well as a comparison with similar homes in the area
Home Values in the Area
Average Home Value in this Area
Purchase History
| Date | Buyer | Sale Price | Title Company |
|---|---|---|---|
| Billy And Janice Eaves Trust | -- | None Listed On Document | |
| Eaves Billy W | -- | -- | |
| Eaves Bill W | -- | Trinity Western Title Co | |
| Ambiance Custom Homes Inc | -- | American Title Company |
Source: Public Records
Mortgage History
| Date | Status | Borrower | Loan Amount |
|---|---|---|---|
| Previous Owner | Eaves Bill W | $170,400 | |
| Previous Owner | Ambiance Custom Homes Inc | $180,000 |
Source: Public Records
Tax History Compared to Growth
Tax History
| Year | Tax Paid | Tax Assessment Tax Assessment Total Assessment is a certain percentage of the fair market value that is determined by local assessors to be the total taxable value of land and additions on the property. | Land | Improvement |
|---|---|---|---|---|
| 2025 | $1,058 | $558,000 | $108,800 | $449,200 |
| 2024 | $1,058 | $592,124 | $108,800 | $483,324 |
| 2023 | $7,940 | $527,154 | $108,800 | $418,354 |
| 2022 | $8,451 | $487,713 | $108,800 | $378,913 |
| 2021 | $8,543 | $389,000 | $100,000 | $289,000 |
| 2020 | $8,521 | $389,000 | $100,000 | $289,000 |
| 2019 | $8,060 | $418,610 | $100,000 | $318,610 |
| 2018 | $992 | $316,907 | $90,000 | $226,907 |
| 2017 | $6,806 | $365,021 | $90,000 | $275,021 |
| 2016 | $6,187 | $357,687 | $90,000 | $267,687 |
| 2015 | $2,270 | $255,500 | $45,000 | $210,500 |
| 2014 | $2,270 | $255,500 | $45,000 | $210,500 |
Source: Public Records
Map
Nearby Homes
- 628 Huntwich Dr
- 4105 Inwood Ln
- 4600 Bransford Rd
- 909 Brestol Ct W
- 405 Woodbriar Ct
- 3605 Spring Valley Dr
- 3624 Wayne Ct
- 4002 Copperwood Ct
- 3609 Wayne Ct
- 4600 Westbury Dr
- 3907 Copperwood Ct
- 4516 Dartmoore Ln
- 3713 Brentwood Ct
- 305 Warbler Dr
- 312 Bremen Dr
- 1109 Simpson Terrace
- 2732 Woodbridge Dr
- 1921 Maplewood Trail
- 405 Bremen Dr
- 1136 Wingate Dr
- 4102 Coachman Ln
- 4106 Coachman Ln
- 4105 Paddington Ln
- 4103 Paddington Ln
- 4107 Paddington Ln
- 4100 Coachman Ln
- 4105 Coachman Ln
- 4103 Coachman Ln
- 4107 Coachman Ln
- 4109 Paddington Ln
- 4101 Paddington Ln
- 4109 Coachman Ln
- 4101 Coachman Ln
- 4110 Coachman Ln
- 4111 Paddington Ln
- 4104 Paddington Ln
- 4111 Coachman Ln
- 4102 Bridlewood Ct
- 4102 Paddington Ln
- 602 Bridlewood S