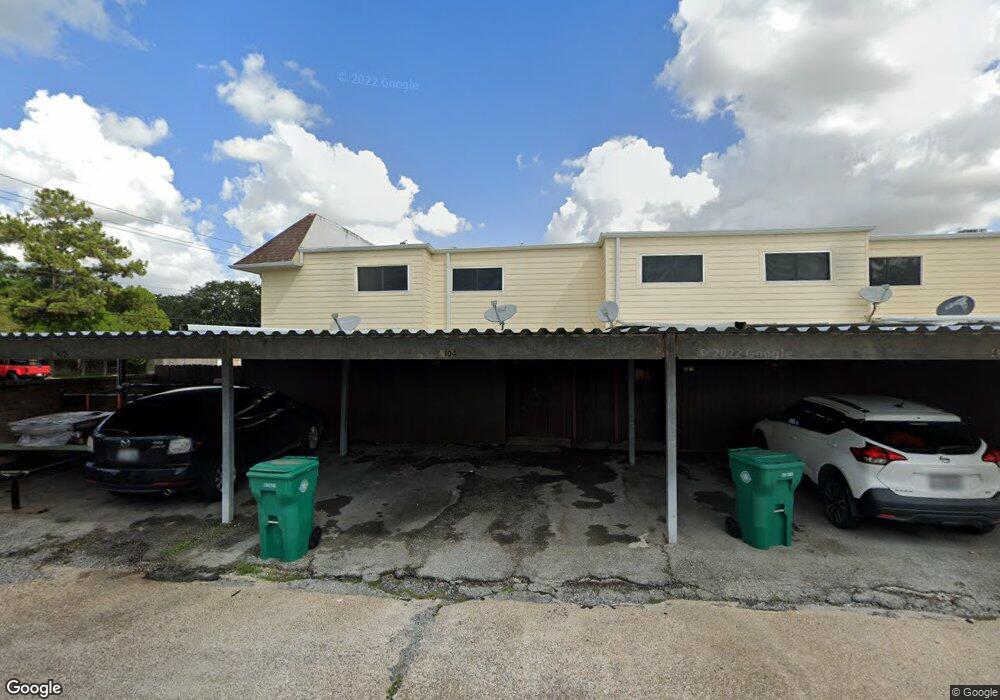
4104 Keeler Ct Unit 3 Pasadena, TX 77503
Estimated Value: $144,063 - $162,000
2
Beds
2
Baths
1,216
Sq Ft
$124/Sq Ft
Est. Value
About This Home
This home is located at 4104 Keeler Ct Unit 3, Pasadena, TX 77503 and is currently estimated at $150,266, approximately $123 per square foot. 4104 Keeler Ct Unit 3 is a home located in Harris County with nearby schools including Carpenter Elementary School, Bonnette Jr High School, and Deer Park High School - North Campus.
Ownership History
Date
Name
Owned For
Owner Type
Purchase Details
Closed on
May 3, 2013
Sold by
Wilbanks Smith Betty
Bought by
Maldonado Roel and Maldonado Annabel S
Current Estimated Value
Purchase Details
Closed on
Dec 9, 2008
Sold by
Murray Jason M and Murray Daisy Jessica
Bought by
Wilbanks Betty
Purchase Details
Closed on
Dec 29, 2005
Sold by
Cardenas Sonia Elizabeth and Cardenas Cesar C
Bought by
Murray Jason M
Home Financials for this Owner
Home Financials are based on the most recent Mortgage that was taken out on this home.
Original Mortgage
$67,480
Interest Rate
6.23%
Mortgage Type
Fannie Mae Freddie Mac
Purchase Details
Closed on
Apr 30, 1999
Sold by
Hudson Cecil C and Hudson Olga Deyon
Bought by
Leoncabrera Sonia Elizabeth
Home Financials for this Owner
Home Financials are based on the most recent Mortgage that was taken out on this home.
Original Mortgage
$50,898
Interest Rate
6.99%
Mortgage Type
VA
Create a Home Valuation Report for This Property
The Home Valuation Report is an in-depth analysis detailing your home's value as well as a comparison with similar homes in the area
Home Values in the Area
Average Home Value in this Area
Purchase History
| Date | Buyer | Sale Price | Title Company |
|---|---|---|---|
| Maldonado Roel | -- | South Land Title Llc | |
| Wilbanks Betty | -- | Startex Title Company | |
| Murray Jason M | -- | Houston Title | |
| Leoncabrera Sonia Elizabeth | -- | First American Title |
Source: Public Records
Mortgage History
| Date | Status | Borrower | Loan Amount |
|---|---|---|---|
| Previous Owner | Murray Jason M | $67,480 | |
| Previous Owner | Leoncabrera Sonia Elizabeth | $50,898 |
Source: Public Records
Tax History Compared to Growth
Tax History
| Year | Tax Paid | Tax Assessment Tax Assessment Total Assessment is a certain percentage of the fair market value that is determined by local assessors to be the total taxable value of land and additions on the property. | Land | Improvement |
|---|---|---|---|---|
| 2025 | $3,622 | $138,491 | $35,625 | $102,866 |
| 2024 | $3,622 | $153,508 | $28,500 | $125,008 |
| 2023 | $3,622 | $153,508 | $28,500 | $125,008 |
| 2022 | $3,011 | $121,869 | $28,500 | $93,369 |
| 2021 | $2,863 | $109,282 | $18,810 | $90,472 |
| 2020 | $2,643 | $95,072 | $18,810 | $76,262 |
| 2019 | $2,538 | $85,477 | $15,675 | $69,802 |
| 2018 | $2,538 | $85,477 | $15,675 | $69,802 |
| 2017 | $2,323 | $78,766 | $13,965 | $64,801 |
| 2016 | $2,323 | $78,766 | $13,965 | $64,801 |
| 2015 | $1,985 | $74,492 | $9,975 | $64,517 |
| 2014 | $1,985 | $67,173 | $9,975 | $57,198 |
Source: Public Records
Map
Nearby Homes
- 1702 Doyle Ct Unit 2
- 4127 Citation Dr
- 2326 Walnut Ct
- 1910 Tulsa St
- 1027 Nantucket St
- 1802 Tulsa St
- 1717 Lexington St
- 1814 Wildwood Dr
- 3809 Newton Dr
- 2202 Kilkenny Ln
- 0 Catalina Dr Unit 39375956
- 2002 Westwind Dr
- 3705 Crawford Dr
- 3405 Chandler Ln
- 3703 Crawford Dr
- 3114 Brookhollow Dr
- 1414 Wexford Dr
- 3505 D h Watkins Dr
- 1313 McDonald St
- 3201 Brookhollow Dr
- 4102 Keeler Ct Unit 3
- 4106 Keeler Ct Unit 3
- 4110 Keeler Ct Unit 3
- 1703 Alabama St Unit 1
- 4112 Keeler Ct Unit 3
- 1705 Alabama St Unit 1
- 4114 Keeler Ct Unit 3
- 4105 Keeler Ct Unit 4
- 4103 Keeler Ct Unit 4
- 4107 Keeler Ct Unit 4
- 4116 Keeler Ct Unit 3
- 1707 Alabama St Unit 1
- 4109 Keeler Ct Unit 4
- 4111 Keeler Ct Unit 4
- 1709 Alabama St Unit 1
- 4113 Keeler Ct Unit 4
- 4115 Keeler Ct
- 1704 Doyle Ct Unit 2
- 1704 Doyle Ct
- 1704 Doyle Ct