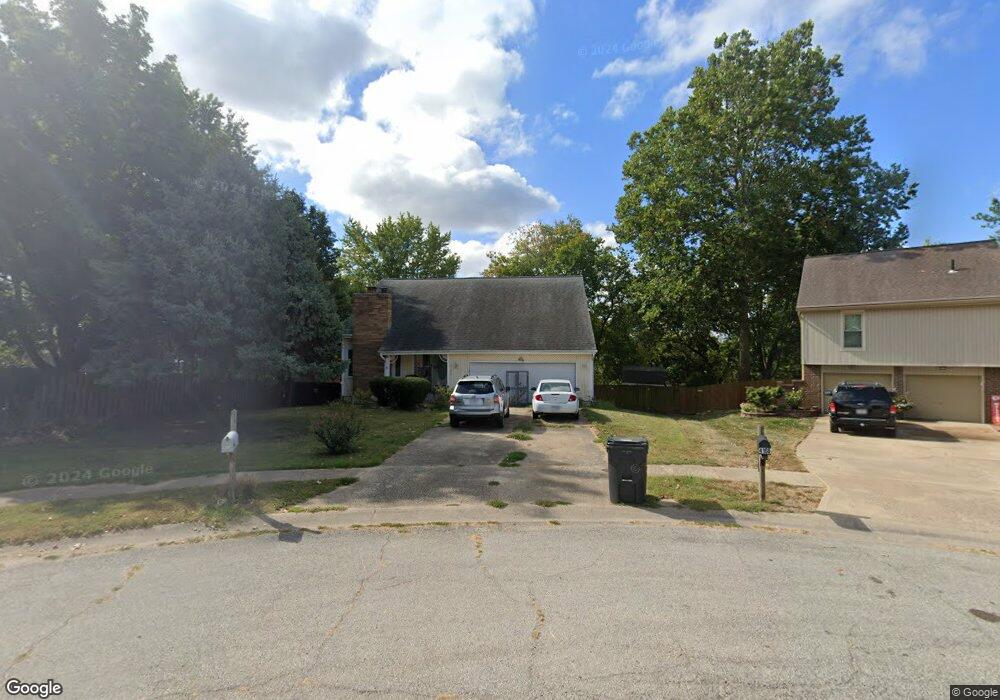
4104 NW Chapel Ln Blue Springs, MO 64015
Estimated Value: $242,000 - $275,040
4
Beds
3
Baths
1,008
Sq Ft
$260/Sq Ft
Est. Value
About This Home
This home is located at 4104 NW Chapel Ln, Blue Springs, MO 64015 and is currently estimated at $261,760, approximately $259 per square foot. 4104 NW Chapel Ln is a home located in Jackson County with nearby schools including John Nowlin Elementary School, Paul Kinder Middle School, and Blue Springs High School.
Ownership History
Date
Name
Owned For
Owner Type
Purchase Details
Closed on
Jun 25, 2009
Sold by
Erisman Virginia
Bought by
Crawford Angela R
Current Estimated Value
Home Financials for this Owner
Home Financials are based on the most recent Mortgage that was taken out on this home.
Original Mortgage
$112,000
Outstanding Balance
$71,030
Interest Rate
4.84%
Mortgage Type
Purchase Money Mortgage
Estimated Equity
$190,730
Purchase Details
Closed on
Mar 18, 2008
Sold by
Deutsche Bank National Trust Co
Bought by
Crawford Angela R and Erisman Virginia
Home Financials for this Owner
Home Financials are based on the most recent Mortgage that was taken out on this home.
Original Mortgage
$104,000
Interest Rate
6.11%
Mortgage Type
Purchase Money Mortgage
Purchase Details
Closed on
Oct 27, 2006
Sold by
Mart Murrel D and Mart Darla
Bought by
Deutsche Bank National Trust Co and Certificateholders Of Carrington Mortgag
Create a Home Valuation Report for This Property
The Home Valuation Report is an in-depth analysis detailing your home's value as well as a comparison with similar homes in the area
Home Values in the Area
Average Home Value in this Area
Purchase History
| Date | Buyer | Sale Price | Title Company |
|---|---|---|---|
| Crawford Angela R | -- | Truhome Title Solutions | |
| Crawford Angela R | -- | Continental Title Company | |
| Deutsche Bank National Trust Co | $168,124 | None Available |
Source: Public Records
Mortgage History
| Date | Status | Borrower | Loan Amount |
|---|---|---|---|
| Open | Crawford Angela R | $112,000 | |
| Previous Owner | Crawford Angela R | $104,000 |
Source: Public Records
Tax History Compared to Growth
Tax History
| Year | Tax Paid | Tax Assessment Tax Assessment Total Assessment is a certain percentage of the fair market value that is determined by local assessors to be the total taxable value of land and additions on the property. | Land | Improvement |
|---|---|---|---|---|
| 2025 | $3,221 | $36,686 | $6,848 | $29,838 |
| 2024 | $3,159 | $39,480 | $9,905 | $29,575 |
| 2023 | $3,159 | $39,480 | $5,088 | $34,392 |
| 2022 | $2,512 | $27,740 | $2,826 | $24,914 |
| 2021 | $2,509 | $27,740 | $2,826 | $24,914 |
| 2020 | $2,344 | $26,355 | $2,826 | $23,529 |
| 2019 | $2,266 | $26,355 | $2,826 | $23,529 |
| 2018 | $891,770 | $22,938 | $2,460 | $20,478 |
| 2017 | $1,992 | $22,938 | $2,460 | $20,478 |
| 2016 | $1,992 | $22,363 | $3,458 | $18,905 |
| 2014 | $2,031 | $22,723 | $3,237 | $19,486 |
Source: Public Records
Map
Nearby Homes
- 4301 NW Briarwood Dr
- 4012 NW Delwood Ct
- 704 NW 39th St
- 14 Emerald Shore Dr
- 4508 NW Valley View Rd
- 4075 SW M 7 Hwy
- 3605 NW Dogwood Dr
- 3616 NW Dogwood Dr
- 3213 NW Canterbury Place
- 3212 NW Canterbury Rd
- 0 No Address Assigned By County N A Unit HMS2492165
- 3205 NW 51st Terrace
- 27 Beach Dr
- 148 Beach Dr
- 41 Clipper Dr
- 2916 NW Chelsea Place
- 5200 NW Primrose Ct
- 5205 NW Primrose Ct
- 1029 NW Berkshire Dr
- 404 Countryside Rd
- 4108 NW Chapel Ln
- 805 NW 41st St
- 4100 NW Chapel Ln
- 4109 NW Briarwood Dr
- 4115 NW Briarwood Dr
- 4105 NW Briarwood Dr
- 4119 NW Briarwood Dr
- 4113 NW Chapel Ln
- 4119 NW Briarwood Dr- Blue Springs
- 4203 NW Briarwood Dr
- 4101 NW Briarwood Dr
- 4101 NW Chapel Ln
- 4207 NW Briarwood Dr
- 4105 NW Chapel Ln
- 4109 NW Chapel Ln
- 804 NW 41st St
- 808 NW 41st St
- 800 NW 41st St
- 808 NW Rosaceae Dr
- 4211 NW Briarwood Dr