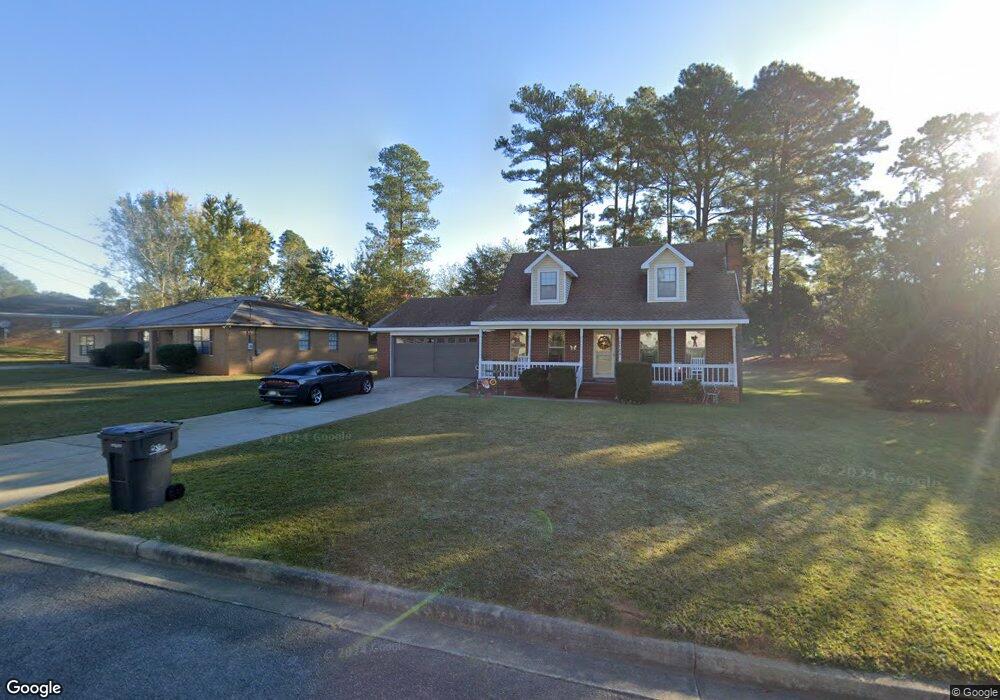
4104 Pinnacle Pines Ct Hephzibah, GA 30815
Jamestown NeighborhoodEstimated Value: $211,646 - $256,000
3
Beds
2
Baths
1,862
Sq Ft
$129/Sq Ft
Est. Value
About This Home
This home is located at 4104 Pinnacle Pines Ct, Hephzibah, GA 30815 and is currently estimated at $239,412, approximately $128 per square foot. 4104 Pinnacle Pines Ct is a home located in Richmond County with nearby schools including Deer Chase Elementary School, Hephzibah Middle School, and Johnson Magnet.
Ownership History
Date
Name
Owned For
Owner Type
Purchase Details
Closed on
May 9, 2018
Sold by
Johnson Robin M
Bought by
Johnson Robin M and Murdaugh Miles E
Current Estimated Value
Purchase Details
Closed on
Jan 28, 2009
Sold by
Johnson Frank L
Bought by
Johnson Robin M
Home Financials for this Owner
Home Financials are based on the most recent Mortgage that was taken out on this home.
Original Mortgage
$109,381
Interest Rate
5.23%
Mortgage Type
FHA
Purchase Details
Closed on
Nov 29, 1993
Sold by
Veterans Affairs Se
Bought by
Johnson Robin M
Purchase Details
Closed on
Oct 22, 1992
Sold by
Barclaysamerican/Mortgage Corp Barclays
Bought by
Veterans Affairs Secretary Of
Purchase Details
Closed on
Oct 6, 1992
Sold by
Barclaysamerican
Bought by
Veterans Affairs Se
Create a Home Valuation Report for This Property
The Home Valuation Report is an in-depth analysis detailing your home's value as well as a comparison with similar homes in the area
Home Values in the Area
Average Home Value in this Area
Purchase History
| Date | Buyer | Sale Price | Title Company |
|---|---|---|---|
| Johnson Robin M | -- | -- | |
| Johnson Robin M | -- | None Available | |
| Johnson Robin M | -- | -- | |
| Veterans Affairs Secretary Of | -- | -- | |
| Veterans Affairs Se | $73,000 | -- |
Source: Public Records
Mortgage History
| Date | Status | Borrower | Loan Amount |
|---|---|---|---|
| Previous Owner | Johnson Robin M | $109,381 |
Source: Public Records
Tax History Compared to Growth
Tax History
| Year | Tax Paid | Tax Assessment Tax Assessment Total Assessment is a certain percentage of the fair market value that is determined by local assessors to be the total taxable value of land and additions on the property. | Land | Improvement |
|---|---|---|---|---|
| 2025 | $2,685 | $82,452 | $10,260 | $72,192 |
| 2024 | $2,685 | $76,552 | $10,260 | $66,292 |
| 2023 | $2,450 | $73,748 | $10,260 | $63,488 |
| 2022 | $2,004 | $57,419 | $10,260 | $47,159 |
| 2021 | $1,702 | $42,518 | $10,260 | $32,258 |
| 2020 | $1,678 | $42,518 | $10,260 | $32,258 |
| 2019 | $1,771 | $42,518 | $10,260 | $32,258 |
| 2018 | $1,620 | $42,518 | $10,260 | $32,258 |
| 2017 | $1,576 | $42,518 | $10,260 | $32,258 |
| 2016 | $1,577 | $42,518 | $10,260 | $32,258 |
| 2015 | $1,587 | $42,518 | $10,260 | $32,258 |
| 2014 | $1,579 | $42,212 | $10,260 | $31,952 |
Source: Public Records
Map
Nearby Homes
- 3753 Woodcock Dr
- 3806 Highpointe Dr
- 4386 Creekview Dr
- 3947 Ellen St
- 3936 Ellen St
- 2614 Sadie Ct
- 407 Woodhazel Way
- 2859 Pepperdine Dr
- 4358 Creekview Dr
- 2712 Fair Oak Ct
- 2640 Carrington Dr
- 2877 Pepperdine Dr
- 2160 Kaneck Way
- 3904 Ellen St
- 3821 Crest Dr
- 3747 Crest Dr
- 3426 Firestone Dr Unit 154
- 3436 Firestone Dr
- 3438 Firestone Dr
- 3442 Firestone Dr
- 4106 Pinnacle Pines Ct
- 3731 Pinnacle Place Dr
- 3729 Pinnacle Place Dr
- 4108 Pinnacle Pines Ct
- 4021 Pinnacle Way
- 4103 Pinnacle Pines Ct
- 4101 Pinnacle Pines Ct
- 4023 Pinnacle Way
- 4105 Pinnacle Pines Ct
- 4019 Pinnacle Way
- 4110 Pinnacle Pines Ct
- 4107 Pinnacle Pines Ct
- 3736 Pinnacle Place Dr
- 3738 Pinnacle Place Dr
- 3735 Pinnacle Place Dr
- 4109 Pinnacle Pines Ct
- 4112 Pinnacle Pines Ct
- 4017 Pinnacle Way
- 3740 Pinnacle Place Dr
- 3734 Pinnacle Place Dr