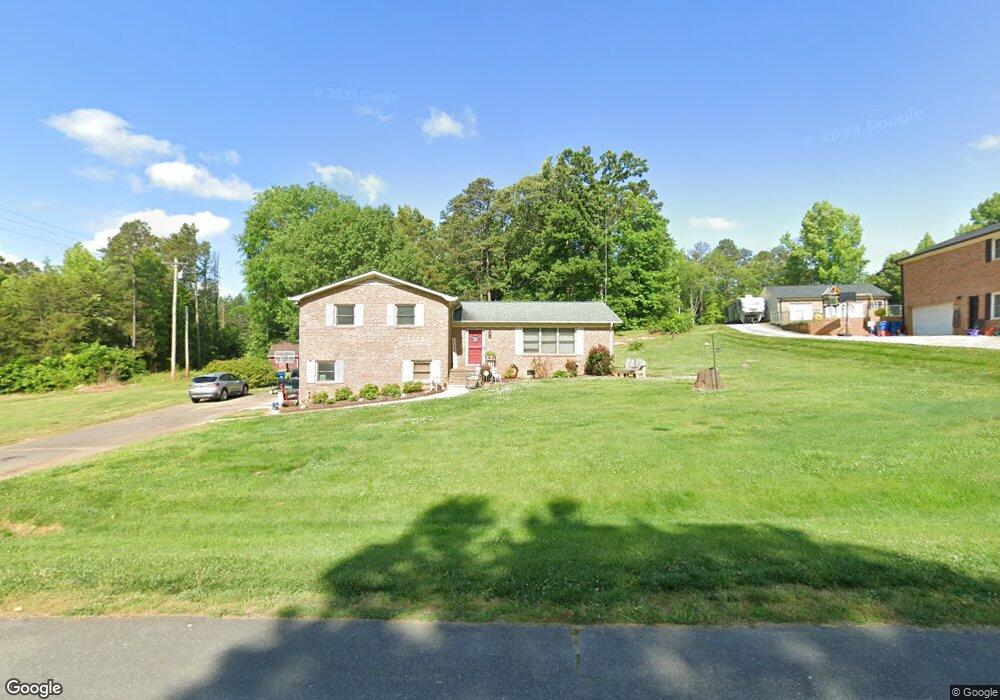
4105 Dakeita Cir Concord, NC 28025
Estimated Value: $359,000 - $623,000
3
Beds
3
Baths
1,710
Sq Ft
$263/Sq Ft
Est. Value
About This Home
This home is located at 4105 Dakeita Cir, Concord, NC 28025 and is currently estimated at $450,229, approximately $263 per square foot. 4105 Dakeita Cir is a home located in Cabarrus County with nearby schools including Bethel Elementary School, C.C. Griffin Middle School, and Central Cabarrus High School.
Ownership History
Date
Name
Owned For
Owner Type
Purchase Details
Closed on
Sep 24, 2018
Sold by
Thornton Anthony T
Bought by
Thornton Anthony T and Thornton Ginger Kay
Current Estimated Value
Home Financials for this Owner
Home Financials are based on the most recent Mortgage that was taken out on this home.
Original Mortgage
$76,312
Outstanding Balance
$47,154
Interest Rate
4.62%
Mortgage Type
FHA
Estimated Equity
$403,075
Purchase Details
Closed on
Sep 24, 1998
Sold by
Thornton Brandi B
Bought by
Thornton Anthony T
Purchase Details
Closed on
May 1, 1995
Bought by
Thornton Anthony T
Purchase Details
Closed on
Aug 1, 1990
Purchase Details
Closed on
May 1, 1984
Create a Home Valuation Report for This Property
The Home Valuation Report is an in-depth analysis detailing your home's value as well as a comparison with similar homes in the area
Home Values in the Area
Average Home Value in this Area
Purchase History
| Date | Buyer | Sale Price | Title Company |
|---|---|---|---|
| Thornton Anthony T | -- | None Available | |
| Thornton Anthony T | -- | -- | |
| Thornton Anthony T | $95,000 | -- | |
| -- | $85,000 | -- | |
| -- | $68,000 | -- |
Source: Public Records
Mortgage History
| Date | Status | Borrower | Loan Amount |
|---|---|---|---|
| Open | Thornton Anthony T | $76,312 |
Source: Public Records
Tax History Compared to Growth
Tax History
| Year | Tax Paid | Tax Assessment Tax Assessment Total Assessment is a certain percentage of the fair market value that is determined by local assessors to be the total taxable value of land and additions on the property. | Land | Improvement |
|---|---|---|---|---|
| 2025 | $2,289 | $338,630 | $87,000 | $251,630 |
| 2024 | $1,948 | $288,200 | $87,000 | $201,200 |
| 2023 | $1,487 | $177,050 | $40,000 | $137,050 |
| 2022 | $1,474 | $175,430 | $40,000 | $135,430 |
| 2021 | $1,421 | $175,430 | $40,000 | $135,430 |
| 2020 | $1,421 | $175,430 | $40,000 | $135,430 |
| 2019 | $1,164 | $143,710 | $50,000 | $93,710 |
| 2018 | $1,121 | $143,710 | $50,000 | $93,710 |
| 2017 | $1,092 | $143,710 | $50,000 | $93,710 |
| 2016 | $1,078 | $147,800 | $60,000 | $87,800 |
| 2015 | $1,103 | $147,800 | $60,000 | $87,800 |
| 2014 | $1,103 | $147,800 | $60,000 | $87,800 |
Source: Public Records
Map
Nearby Homes
- 8629 Hayden Way
- 7787 Us Highway 601 S
- 3850 Willow Grove Ln Unit 24
- 10116 Robert Bost Rd
- 1845 Flowes Store Rd E
- 10483 Troutman Rd
- 10620 U S 601
- 10670 Troutman Rd
- 10130 Reed Mine Rd
- 4207 Amanda Dr
- 3400 Biggers Rd
- 3715 Vanderburg Dr
- 11055 Graybark Rd
- 11060 Teresia Ln
- 3500 Biggers Rd
- 00 John Furr Rd Unit 3
- 2555 Biggers Rd
- 10791 Hartsell Rd
- 5791 N Carolina 200
- 11790 Thurber Place
- 4109 Dakeita Cir
- 4095 Dakeita Cir
- 3704 Baptist Ln
- 4100 Dakeita Cir
- 3610 Baptist Ln
- 4125 Dakeita Cir
- 3714 Baptist Ln
- 4096 Dakeita Cir
- 4124 Dakeita Cir
- 4094 Dakeita Cir
- 3700 Dakeita Cir
- 4090 Dakeita Cir
- 00. Hwy 601 Hwy
- 0 Hwy 601 None Unit 951812
- 00000 Hwy 601 None
- 0000 S Hwy 601 Hwy
- 3612 Dakeita Cir
- 3704 Dakeita Cir
- 3741 Baptist Ln
- 4087 Dakeita Cir