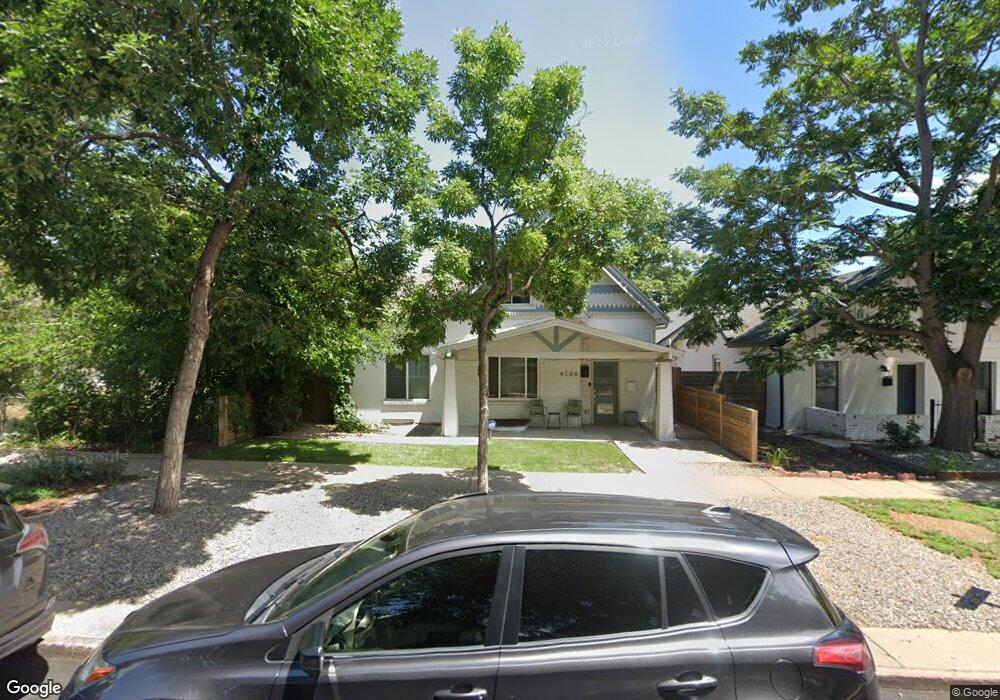
4106 Osage St Denver, CO 80211
Sunnyside NeighborhoodEstimated Value: $1,000,000 - $1,061,272
3
Beds
3
Baths
2,373
Sq Ft
$431/Sq Ft
Est. Value
About This Home
This home is located at 4106 Osage St, Denver, CO 80211 and is currently estimated at $1,023,568, approximately $431 per square foot. 4106 Osage St is a home located in Denver County with nearby schools including Bryant Webster Dual Language School, Denver Montessori Junior/Senior High School, and Skinner Middle School.
Ownership History
Date
Name
Owned For
Owner Type
Purchase Details
Closed on
Aug 28, 2017
Sold by
Pag Rei Inc
Bought by
Hunt Shane E and Platt Lauren M
Current Estimated Value
Home Financials for this Owner
Home Financials are based on the most recent Mortgage that was taken out on this home.
Original Mortgage
$517,500
Outstanding Balance
$433,650
Interest Rate
4.03%
Mortgage Type
New Conventional
Estimated Equity
$589,918
Purchase Details
Closed on
Feb 17, 2017
Sold by
4106 Osage Trust
Bought by
Pag Rei Inc
Home Financials for this Owner
Home Financials are based on the most recent Mortgage that was taken out on this home.
Original Mortgage
$424,000
Interest Rate
4.2%
Mortgage Type
Construction
Purchase Details
Closed on
Jun 24, 2014
Sold by
Muro John E
Bought by
Muro John J
Purchase Details
Closed on
Oct 25, 2002
Sold by
Muro Richard E
Bought by
Muro Richard E and Muro John E
Create a Home Valuation Report for This Property
The Home Valuation Report is an in-depth analysis detailing your home's value as well as a comparison with similar homes in the area
Home Values in the Area
Average Home Value in this Area
Purchase History
| Date | Buyer | Sale Price | Title Company |
|---|---|---|---|
| Hunt Shane E | $690,000 | Fidelity National Title | |
| Pag Rei Inc | $338,000 | None Available | |
| 4106 Osage Trust | $318,000 | None Available | |
| Muro John J | -- | None Available | |
| Muro Richard E | -- | -- |
Source: Public Records
Mortgage History
| Date | Status | Borrower | Loan Amount |
|---|---|---|---|
| Open | Hunt Shane E | $517,500 | |
| Previous Owner | Pag Rei Inc | $424,000 |
Source: Public Records
Tax History Compared to Growth
Tax History
| Year | Tax Paid | Tax Assessment Tax Assessment Total Assessment is a certain percentage of the fair market value that is determined by local assessors to be the total taxable value of land and additions on the property. | Land | Improvement |
|---|---|---|---|---|
| 2024 | $6,068 | $76,620 | $30,280 | $46,340 |
| 2023 | $5,937 | $76,620 | $30,280 | $46,340 |
| 2022 | $4,391 | $55,220 | $29,950 | $25,270 |
| 2021 | $4,239 | $56,810 | $30,810 | $26,000 |
| 2020 | $3,788 | $51,060 | $25,380 | $25,680 |
| 2019 | $3,682 | $51,060 | $25,380 | $25,680 |
| 2018 | $3,350 | $43,300 | $19,890 | $23,410 |
| 2017 | $2,147 | $27,830 | $19,890 | $7,940 |
| 2016 | $1,805 | $22,130 | $14,344 | $7,786 |
| 2015 | $1,729 | $22,130 | $14,344 | $7,786 |
| 2014 | $1,021 | $12,290 | $4,036 | $8,254 |
Source: Public Records
Map
Nearby Homes