Estimated Value: $411,000 - $560,000
--
Bed
--
Bath
855
Sq Ft
$565/Sq Ft
Est. Value
About This Home
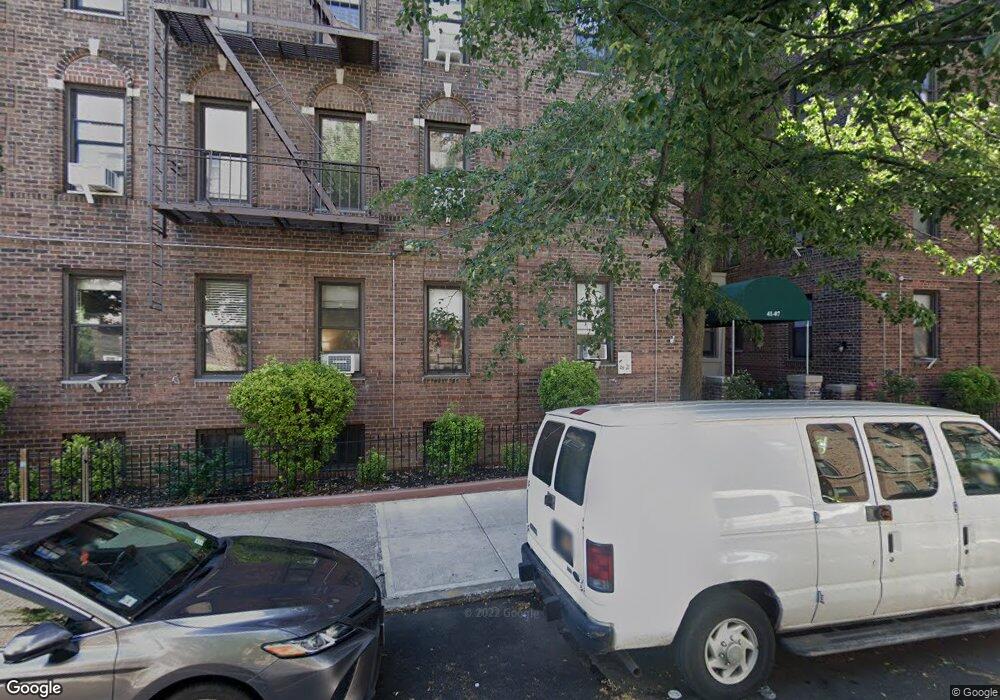
This home is located at 4107 42nd St Unit 5E, Sunnyside, NY 11104 and is currently estimated at $482,859, approximately $564 per square foot. 4107 42nd St Unit 5E is a home located in Queens County with nearby schools including P.S. 150Q Sunnyside, Long Island City High School, and Most Precious Blood Roman Catholic Church.
Ownership History
Date
Name
Owned For
Owner Type
Purchase Details
Closed on
Oct 25, 2011
Sold by
Rivera Wilfredo and Tang Jun
Bought by
Wami Guidi R
Current Estimated Value
Purchase Details
Closed on
Oct 13, 1999
Sold by
Koo Hongtau and Tang Yiling
Bought by
Rivera Wilfredo and Tang Jun
Home Financials for this Owner
Home Financials are based on the most recent Mortgage that was taken out on this home.
Original Mortgage
$67,500
Interest Rate
7.68%
Purchase Details
Closed on
Nov 29, 1994
Sold by
Citibank Na
Bought by
Tang Yiling and Koo Hongtau
Home Financials for this Owner
Home Financials are based on the most recent Mortgage that was taken out on this home.
Original Mortgage
$38,400
Interest Rate
8.96%
Mortgage Type
Seller Take Back
Create a Home Valuation Report for This Property
The Home Valuation Report is an in-depth analysis detailing your home's value as well as a comparison with similar homes in the area
Home Values in the Area
Average Home Value in this Area
Purchase History
| Date | Buyer | Sale Price | Title Company |
|---|---|---|---|
| Wami Guidi R | $220,000 | -- | |
| Wami Guidi R | $220,000 | -- | |
| Rivera Wilfredo | $95,000 | -- | |
| Rivera Wilfredo | -- | -- | |
| Tang Yiling | $48,000 | -- | |
| Tang Yiling | $48,000 | -- |
Source: Public Records
Mortgage History
| Date | Status | Borrower | Loan Amount |
|---|---|---|---|
| Previous Owner | Rivera Wilfredo | $67,500 | |
| Previous Owner | Tang Yiling | $38,400 |
Source: Public Records
Tax History Compared to Growth
Tax History
| Year | Tax Paid | Tax Assessment Tax Assessment Total Assessment is a certain percentage of the fair market value that is determined by local assessors to be the total taxable value of land and additions on the property. | Land | Improvement |
|---|---|---|---|---|
| 2025 | $4,528 | $37,588 | $4,508 | $33,080 |
| 2024 | $4,528 | $36,222 | $4,508 | $31,714 |
| 2023 | $4,189 | $33,503 | $4,508 | $28,995 |
| 2022 | $3,841 | $35,410 | $4,508 | $30,902 |
| 2021 | $3,629 | $30,012 | $4,508 | $25,504 |
| 2020 | $2,564 | $35,237 | $4,508 | $30,729 |
| 2019 | $2,347 | $30,106 | $4,508 | $25,598 |
| 2018 | $3,090 | $24,298 | $4,509 | $19,789 |
| 2017 | $2,941 | $23,120 | $4,508 | $18,612 |
| 2016 | $2,850 | $23,120 | $4,508 | $18,612 |
| 2015 | $1,598 | $21,052 | $4,508 | $16,544 |
| 2014 | $1,598 | $20,462 | $4,508 | $15,954 |
Source: Public Records
About This Building
Map
Nearby Homes
- 4107 42nd St Unit 2J
- 41-08 43rd St Unit 5J
- 41-09 41st St Unit 1-D
- 41-12 41st St Unit 3 H
- 41-12 41st St Unit 2J
- 41-42 42nd St Unit E4
- 41-41 41st St Unit 1G
- 41-15 44th St Unit 6C
- 41-25 44th St Unit C5
- 41-30 45th St
- 3970 45th St
- 44-15 43rd Ave Unit 5N
- 41-15 39th Place Unit 1
- 41-15 39th Place Unit 3
- 41-21 39th Place
- 41-13 39th Place Unit 3
- 41-22 44th St
- 4333 42nd St Unit 6A
- 43-33 42nd St Unit 6B
- 3951 45th St Unit 1
- 4107 42nd St
- 4107 42nd St
- 4107 42nd St Unit 3A
- 4107 42nd St Unit 4F
- 4107 42nd St Unit 4G
- 4107 42nd St Unit 5K
- 4107 42nd St Unit 2K
- 4107 42nd St Unit 1K
- 4107 42nd St Unit 5G
- 4107 42nd St Unit 3F
- 4107 42nd St Unit 1F
- 4107 42nd St Unit 2E
- 4107 42nd St Unit 5D
- 4107 42nd St Unit 5C
- 4107 42nd St Unit 6B
- 4107 42nd St Unit 1B
- 4107 42nd St Unit 4A
- 4107 42nd St Unit 2A
- 4107 42nd St Unit 1A
- 4107 42nd St Unit 5A