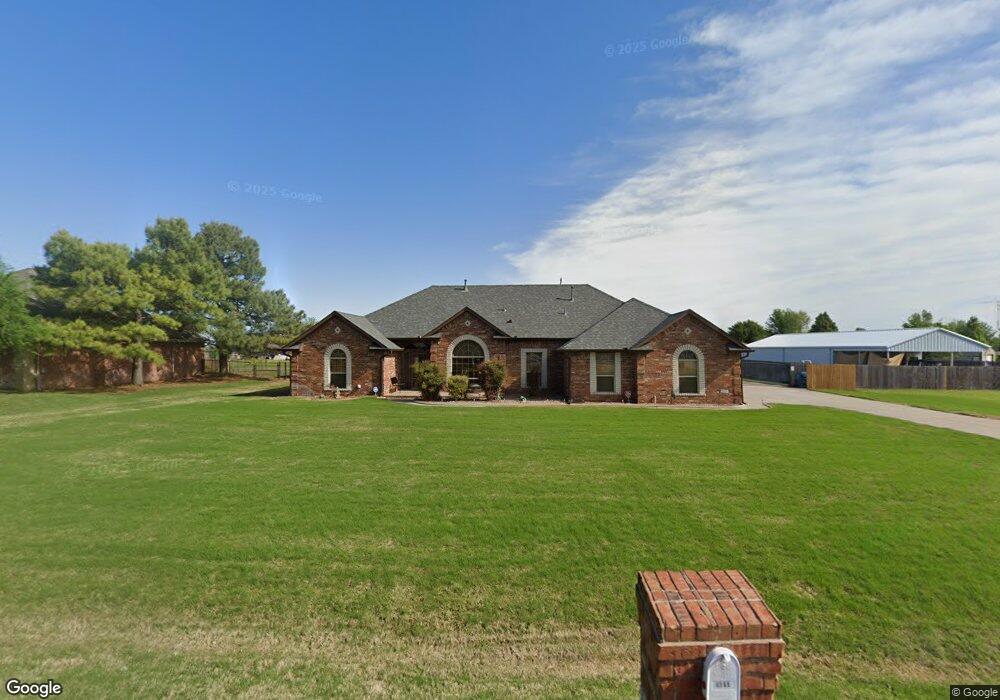
4107 Nugget Ln Tuttle, OK 73089
Estimated Value: $355,979 - $422,000
3
Beds
2
Baths
2,015
Sq Ft
$194/Sq Ft
Est. Value
About This Home
This home is located at 4107 Nugget Ln, Tuttle, OK 73089 and is currently estimated at $389,995, approximately $193 per square foot. 4107 Nugget Ln is a home located in Grady County with nearby schools including Tuttle Elementary School, Tuttle Intermediate School, and Tuttle Middle School.
Ownership History
Date
Name
Owned For
Owner Type
Purchase Details
Closed on
Aug 5, 2009
Sold by
Wilson Galyn and Wilson Vivian
Bought by
Vanvancoover Richard Van and Coover Tamra
Current Estimated Value
Home Financials for this Owner
Home Financials are based on the most recent Mortgage that was taken out on this home.
Original Mortgage
$172,771
Outstanding Balance
$112,072
Interest Rate
5.19%
Mortgage Type
FHA
Estimated Equity
$277,923
Purchase Details
Closed on
Jul 29, 2005
Sold by
M & J Homes Llc
Bought by
Wilson Galyn W and Wilson Vivian M
Home Financials for this Owner
Home Financials are based on the most recent Mortgage that was taken out on this home.
Original Mortgage
$109,900
Interest Rate
5.55%
Mortgage Type
New Conventional
Purchase Details
Closed on
Mar 22, 2005
Sold by
Windle Joseph R and Windle Christy L
Bought by
Monroe Michael J and Monroe Kimberly D
Home Financials for this Owner
Home Financials are based on the most recent Mortgage that was taken out on this home.
Original Mortgage
$131,200
Interest Rate
5.67%
Mortgage Type
Purchase Money Mortgage
Purchase Details
Closed on
Jul 14, 2004
Sold by
Silver Ridge Development
Bought by
Windle Joseph R and Windle Chris
Create a Home Valuation Report for This Property
The Home Valuation Report is an in-depth analysis detailing your home's value as well as a comparison with similar homes in the area
Home Values in the Area
Average Home Value in this Area
Purchase History
| Date | Buyer | Sale Price | Title Company |
|---|---|---|---|
| Vanvancoover Richard Van | $176,000 | None Available | |
| Wilson Galyn W | $170,000 | None Available | |
| Monroe Michael J | $20,000 | Warranty Title | |
| M & J Homes Llc | -- | Warranty Title | |
| Windle Joseph R | $19,500 | -- |
Source: Public Records
Mortgage History
| Date | Status | Borrower | Loan Amount |
|---|---|---|---|
| Open | Vanvancoover Richard Van | $172,771 | |
| Previous Owner | Wilson Galyn W | $109,900 | |
| Previous Owner | Monroe Michael J | $131,200 |
Source: Public Records
Tax History
| Year | Tax Paid | Tax Assessment Tax Assessment Total Assessment is a certain percentage of the fair market value that is determined by local assessors to be the total taxable value of land and additions on the property. | Land | Improvement |
|---|---|---|---|---|
| 2025 | $2,718 | $26,799 | $3,338 | $23,461 |
| 2024 | $2,842 | $26,018 | $3,241 | $22,777 |
| 2023 | $2,842 | $25,260 | $3,162 | $22,098 |
| 2022 | $2,584 | $24,524 | $2,250 | $22,274 |
| 2021 | $2,516 | $23,811 | $2,451 | $21,360 |
| 2020 | $2,465 | $23,116 | $2,355 | $20,761 |
| 2019 | $2,348 | $22,444 | $2,346 | $20,098 |
| 2018 | $2,150 | $21,790 | $2,272 | $19,518 |
| 2017 | $2,139 | $21,156 | $2,201 | $18,955 |
| 2016 | $2,111 | $20,539 | $2,116 | $18,423 |
| 2015 | $1,881 | $19,941 | $2,142 | $17,799 |
| 2014 | $1,881 | $19,360 | $2,200 | $17,160 |
Source: Public Records
Map
Nearby Homes
- 1455 Deer Ridge Run
- 1235 Deer Ridge
- 4606 Shoreside Dr
- 1401 Deer Ridge Run
- 1425 Deer Ridge Run
- 1417 Deer Ridge Run
- 4605 Pikeys Trail
- 1136 Jozie Way
- 1120 Jozie Way
- 4333 Courtlyn Ave
- 1137 Jaden Blvd
- 1129 Jaden Blvd
- 1050 Colonial Ave
- 2045 E Rock Creek Rd
- 5113 Brooke Rd
- 5405 Daxton Dr
- 436 Silas Dr
- 408 Labelle Ln
- 440 Silas Dr
- 444 Silas Dr
- 4109 Nugget Ln
- 4105 Nugget Ln
- 4111 Nugget Ln
- 4106 Nugget Ln
- 4103 Nugget Ln
- 4108 Nugget Ln
- 4104 Nugget Ln
- 4106 Frontier Ln
- 4110 Nugget Ln
- 4108 Frontier Ln
- 4115 Nugget Ln
- 4104 Frontier Ln
- 4112 Nugget Ln
- 4102 Nugget Ln
- 4116 Nugget Ln
- 4110 Frontier Ln
- 1708 Riviera Dr
- 4021 Nugget Ln
- 4203 Nugget Ln
- 4020 Nugget Ln
Your Personal Tour Guide
Ask me questions while you tour the home.