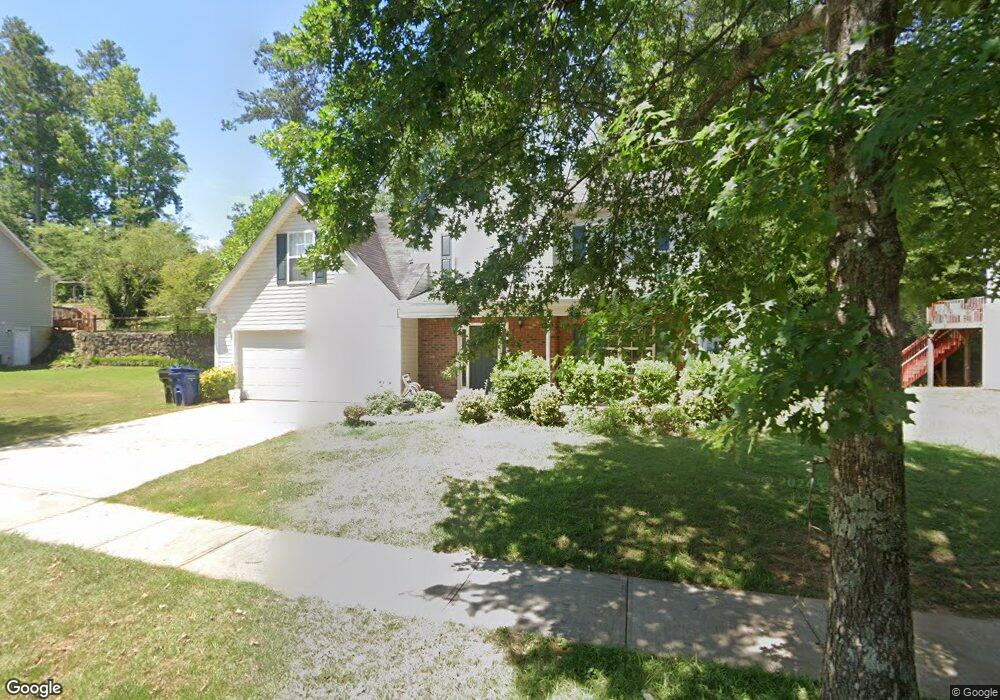
4107 Shoreside Cir SW Snellville, GA 30039
Estimated Value: $313,000 - $339,719
4
Beds
3
Baths
1,886
Sq Ft
$176/Sq Ft
Est. Value
About This Home
This home is located at 4107 Shoreside Cir SW, Snellville, GA 30039 and is currently estimated at $331,680, approximately $175 per square foot. 4107 Shoreside Cir SW is a home located in Gwinnett County with nearby schools including Anderson-Livsey Elementary School, Shiloh Middle School, and Shiloh High School.
Ownership History
Date
Name
Owned For
Owner Type
Purchase Details
Closed on
Aug 2, 2018
Sold by
Property Owner 4 Llc
Bought by
Progress Residential Borrower 4 Llc
Current Estimated Value
Purchase Details
Closed on
Nov 8, 2017
Sold by
Mike Haralson Inc
Bought by
Property Owner 4 Llc
Purchase Details
Closed on
Sep 22, 2017
Sold by
Gasper Richard Joseph Esta
Bought by
Mike Haralson Inc
Purchase Details
Closed on
Jul 21, 2006
Sold by
Jackson Damon and Jackson Miyesha
Bought by
Gasper Richard J and Gasper Marva H
Home Financials for this Owner
Home Financials are based on the most recent Mortgage that was taken out on this home.
Original Mortgage
$142,800
Interest Rate
6.6%
Mortgage Type
New Conventional
Purchase Details
Closed on
Sep 27, 2002
Sold by
Damascus Homes Llc
Bought by
Jackson Damon and Jackson Miyesha
Home Financials for this Owner
Home Financials are based on the most recent Mortgage that was taken out on this home.
Original Mortgage
$142,962
Interest Rate
6.21%
Mortgage Type
FHA
Create a Home Valuation Report for This Property
The Home Valuation Report is an in-depth analysis detailing your home's value as well as a comparison with similar homes in the area
Home Values in the Area
Average Home Value in this Area
Purchase History
| Date | Buyer | Sale Price | Title Company |
|---|---|---|---|
| Progress Residential Borrower 4 Llc | -- | -- | |
| Property Owner 4 Llc | $174,000 | -- | |
| Mike Haralson Inc | $114,000 | -- | |
| Gasper Richard J | $168,000 | -- | |
| Jackson Damon | $145,300 | -- |
Source: Public Records
Mortgage History
| Date | Status | Borrower | Loan Amount |
|---|---|---|---|
| Previous Owner | Gasper Richard J | $142,800 | |
| Previous Owner | Jackson Damon | $142,962 |
Source: Public Records
Property History
| Date | Event | Price | List to Sale | Price per Sq Ft |
|---|---|---|---|---|
| 09/02/2025 09/02/25 | Price Changed | $2,055 | -1.0% | $1 / Sq Ft |
| 08/29/2025 08/29/25 | Price Changed | $2,075 | -1.0% | $1 / Sq Ft |
| 08/25/2025 08/25/25 | Price Changed | $2,095 | -0.9% | $1 / Sq Ft |
| 07/30/2025 07/30/25 | Price Changed | $2,115 | -2.1% | $1 / Sq Ft |
| 07/23/2025 07/23/25 | Price Changed | $2,160 | -0.9% | $1 / Sq Ft |
| 07/16/2025 07/16/25 | Price Changed | $2,180 | -3.5% | $1 / Sq Ft |
| 07/15/2025 07/15/25 | Price Changed | $2,260 | +0.2% | $1 / Sq Ft |
| 07/14/2025 07/14/25 | Price Changed | $2,255 | -0.7% | $1 / Sq Ft |
| 07/13/2025 07/13/25 | Price Changed | $2,270 | +0.2% | $1 / Sq Ft |
| 07/12/2025 07/12/25 | Price Changed | $2,265 | +0.2% | $1 / Sq Ft |
| 07/11/2025 07/11/25 | Price Changed | $2,260 | +0.2% | $1 / Sq Ft |
| 07/10/2025 07/10/25 | Price Changed | $2,255 | -1.5% | $1 / Sq Ft |
| 07/09/2025 07/09/25 | Price Changed | $2,290 | -1.1% | $1 / Sq Ft |
| 07/06/2025 07/06/25 | Price Changed | $2,315 | +2.4% | $1 / Sq Ft |
| 07/04/2025 07/04/25 | Price Changed | $2,260 | +1.6% | $1 / Sq Ft |
| 07/03/2025 07/03/25 | Price Changed | $2,225 | +1.4% | $1 / Sq Ft |
| 07/02/2025 07/02/25 | Price Changed | $2,195 | -0.9% | $1 / Sq Ft |
| 06/28/2025 06/28/25 | Price Changed | $2,215 | -1.8% | $1 / Sq Ft |
| 06/22/2025 06/22/25 | Price Changed | $2,255 | +2.5% | $1 / Sq Ft |
| 06/20/2025 06/20/25 | Price Changed | $2,200 | -0.2% | $1 / Sq Ft |
| 06/18/2025 06/18/25 | Price Changed | $2,205 | -0.2% | $1 / Sq Ft |
| 06/16/2025 06/16/25 | Price Changed | $2,210 | +2.3% | $1 / Sq Ft |
| 06/11/2025 06/11/25 | Price Changed | $2,160 | -0.2% | $1 / Sq Ft |
| 06/09/2025 06/09/25 | Price Changed | $2,165 | -0.2% | $1 / Sq Ft |
| 06/07/2025 06/07/25 | Price Changed | $2,170 | -1.8% | $1 / Sq Ft |
| 06/06/2025 06/06/25 | Price Changed | $2,210 | -0.2% | $1 / Sq Ft |
| 06/01/2025 06/01/25 | Price Changed | $2,215 | -0.2% | $1 / Sq Ft |
| 05/31/2025 05/31/25 | Price Changed | $2,220 | +0.5% | $1 / Sq Ft |
| 05/30/2025 05/30/25 | Price Changed | $2,210 | 0.0% | $1 / Sq Ft |
| 05/30/2025 05/30/25 | For Rent | $2,210 | -0.2% | -- |
| 05/27/2025 05/27/25 | Off Market | $2,215 | -- | -- |
| 05/17/2025 05/17/25 | Price Changed | $2,215 | +2.5% | $1 / Sq Ft |
| 05/15/2025 05/15/25 | Price Changed | $2,160 | -1.8% | $1 / Sq Ft |
| 05/11/2025 05/11/25 | Price Changed | $2,200 | -0.2% | $1 / Sq Ft |
| 05/10/2025 05/10/25 | Price Changed | $2,205 | +2.1% | $1 / Sq Ft |
| 05/06/2025 05/06/25 | Price Changed | $2,160 | 0.0% | $1 / Sq Ft |
| 05/06/2025 05/06/25 | For Rent | $2,160 | +2.4% | -- |
| 01/27/2025 01/27/25 | Off Market | $2,110 | -- | -- |
| 01/20/2025 01/20/25 | Price Changed | $2,110 | -0.2% | $1 / Sq Ft |
| 01/17/2025 01/17/25 | Price Changed | $2,115 | +0.2% | $1 / Sq Ft |
| 01/15/2025 01/15/25 | Price Changed | $2,110 | +1.0% | $1 / Sq Ft |
| 01/14/2025 01/14/25 | Price Changed | $2,090 | -0.5% | $1 / Sq Ft |
| 01/12/2025 01/12/25 | Price Changed | $2,100 | +0.2% | $1 / Sq Ft |
| 01/03/2025 01/03/25 | Price Changed | $2,095 | -2.3% | $1 / Sq Ft |
| 12/31/2024 12/31/24 | Price Changed | $2,145 | -0.5% | $1 / Sq Ft |
| 12/29/2024 12/29/24 | Price Changed | $2,155 | +0.5% | $1 / Sq Ft |
| 12/26/2024 12/26/24 | Price Changed | $2,145 | +0.2% | $1 / Sq Ft |
| 12/24/2024 12/24/24 | Price Changed | $2,140 | +0.5% | $1 / Sq Ft |
| 12/20/2024 12/20/24 | For Rent | $2,130 | -- | -- |
Tax History Compared to Growth
Tax History
| Year | Tax Paid | Tax Assessment Tax Assessment Total Assessment is a certain percentage of the fair market value that is determined by local assessors to be the total taxable value of land and additions on the property. | Land | Improvement |
|---|---|---|---|---|
| 2024 | $4,633 | $119,720 | $25,800 | $93,920 |
| 2023 | $4,633 | $112,840 | $26,000 | $86,840 |
| 2022 | $4,233 | $109,600 | $24,000 | $85,600 |
| 2021 | $2,844 | $69,640 | $13,840 | $55,800 |
| 2020 | $2,858 | $69,640 | $13,840 | $55,800 |
| 2019 | $2,388 | $69,640 | $13,840 | $55,800 |
| 2018 | $2,478 | $61,800 | $13,840 | $47,960 |
| 2016 | $1,766 | $46,840 | $10,000 | $36,840 |
| 2015 | $1,681 | $44,120 | $8,000 | $36,120 |
| 2014 | -- | $44,120 | $8,000 | $36,120 |
Source: Public Records
Map
Nearby Homes
- 4237 Shoreside Cir Unit 1
- 4111 Wrexham Dr
- 3992 Wrexham Dr
- 4211 Crestside Ridge
- 4331 Wrexham Ct
- 3909 Laurens Ln
- 4107 Round Stone Trail
- 3885 Laurens Ln
- 4212 Medlock River Ct
- 3774 Summit View Ln
- 4357 James Wade Dr
- 4262 Mountain Glen Trace
- 4184 Red Laurel Way
- 3915 Laurel Brook Way Unit 2
- 4341 Horder Ct
- 3926 Yosemite Park Ln
- 4311 Marci St
- 4107 Shoreside Cir
- 4087 Shoreside Cir Unit 1
- 4117 Shoreside Cir
- 4106 Shoreside Cir
- 4086 Shoreside Cir Unit 1
- 4084 Huddersfield Dr
- 4096 Shoreside Cir
- 4074 Huddersfield Dr Unit 2
- 4116 Shoreside Cir Unit 1
- 4077 Shoreside Cir
- 4094 Huddersfield Dr
- 4127 Shoreside Cir Unit 1
- 4076 Shoreside Cir
- 4064 Huddersfield Dr Unit 2
- 4156 Shoreside Cir
- 4137 Shoreside Cir
- 4066 Shoreside Cir Unit 1
- 4057 Shoreside Cir
- 5004 Huddersfield Dr
- 4147 Shoreside Cir Unit 1