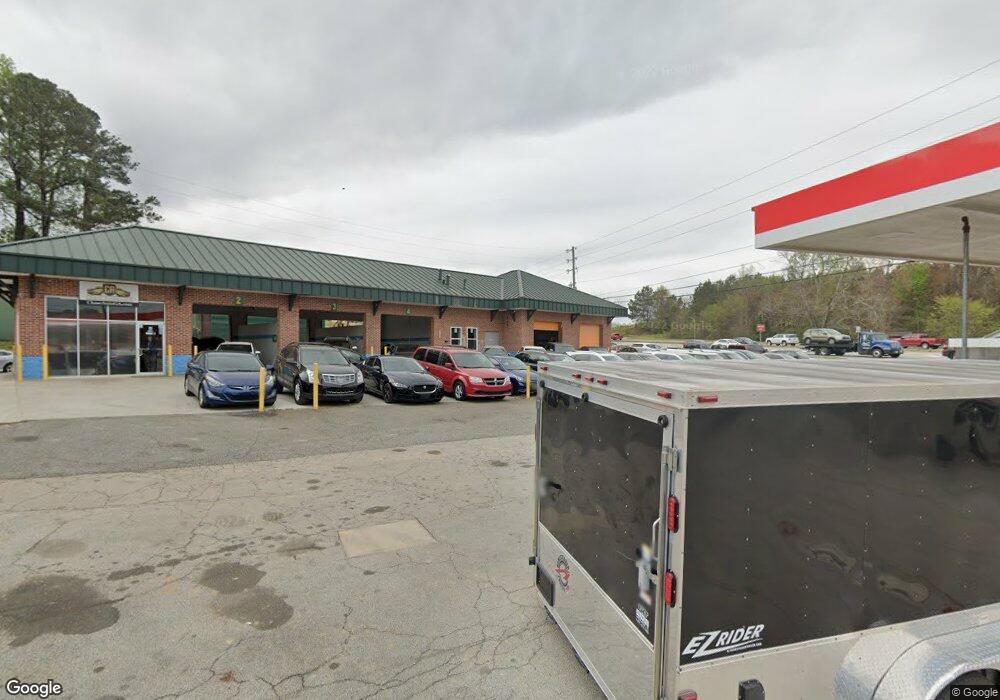
4107 Winder Hwy Flowery Branch, GA 30542
Estimated Value: $632,126
--
Bed
--
Bath
3,175
Sq Ft
$199/Sq Ft
Est. Value
About This Home
This home is located at 4107 Winder Hwy, Flowery Branch, GA 30542 and is currently estimated at $632,126, approximately $199 per square foot. 4107 Winder Hwy is a home located in Hall County with nearby schools including Chicopee Elementary School, South Hall Middle School, and Johnson High School.
Ownership History
Date
Name
Owned For
Owner Type
Purchase Details
Closed on
Mar 13, 2020
Sold by
Holcomb & Holcomb Investments Llc
Bought by
Chase Car Center Llc
Current Estimated Value
Home Financials for this Owner
Home Financials are based on the most recent Mortgage that was taken out on this home.
Original Mortgage
$386,000
Outstanding Balance
$78,311
Interest Rate
3.4%
Mortgage Type
New Conventional
Estimated Equity
$553,815
Purchase Details
Closed on
May 31, 2019
Sold by
Karantza Kimberly A
Bought by
Holcomb & Holcomb Investments Llc
Purchase Details
Closed on
Jul 21, 2017
Sold by
Holcomb
Bought by
Karantza Kimberly A
Home Financials for this Owner
Home Financials are based on the most recent Mortgage that was taken out on this home.
Original Mortgage
$443,500
Interest Rate
3.23%
Purchase Details
Closed on
Oct 7, 1997
Sold by
Holcomb Robert E
Bought by
Holcomb Mary S
Create a Home Valuation Report for This Property
The Home Valuation Report is an in-depth analysis detailing your home's value as well as a comparison with similar homes in the area
Home Values in the Area
Average Home Value in this Area
Purchase History
| Date | Buyer | Sale Price | Title Company |
|---|---|---|---|
| Chase Car Center Llc | $395,000 | -- | |
| Holcomb & Holcomb Investments Llc | -- | -- | |
| Karantza Kimberly A | $600,000 | -- | |
| Holcomb Mary S | -- | -- |
Source: Public Records
Mortgage History
| Date | Status | Borrower | Loan Amount |
|---|---|---|---|
| Open | Chase Car Center Llc | $386,000 | |
| Previous Owner | Karantza Kimberly A | $443,500 |
Source: Public Records
Tax History Compared to Growth
Tax History
| Year | Tax Paid | Tax Assessment Tax Assessment Total Assessment is a certain percentage of the fair market value that is determined by local assessors to be the total taxable value of land and additions on the property. | Land | Improvement |
|---|---|---|---|---|
| 2024 | $6,819 | $232,960 | $105,720 | $127,240 |
| 2023 | $7,078 | $233,440 | $105,720 | $127,720 |
| 2022 | $4,830 | $184,720 | $78,960 | $105,760 |
| 2021 | $4,570 | $171,560 | $78,960 | $92,600 |
| 2020 | $3,931 | $145,640 | $78,960 | $66,680 |
| 2019 | $2,776 | $101,920 | $35,240 | $66,680 |
| 2018 | $2,869 | $101,920 | $35,240 | $66,680 |
| 2017 | $2,838 | $101,920 | $35,240 | $66,680 |
| 2016 | $2,769 | $101,920 | $35,240 | $66,680 |
| 2015 | $2,663 | $113,680 | $47,000 | $66,680 |
| 2014 | $2,663 | $97,240 | $32,840 | $64,400 |
Source: Public Records
Map
Nearby Homes
- 4743 Amsterdam Ln
- 4708 Upper Berkshire Rd Unit 39
- 4838 Netherlands Place
- 3929 Perry Ln
- 4610 Blakeford Ct
- 4835 Upper Berkshire Rd
- 4446 Union Church Rd
- 4684 Martins Crossing Dr W
- 4434 Oxburgh Park
- 5061 Pointer Ridge
- 4439 Oxburgh Park
- 5055 Pointer Ridge
- 4478 Longmead Rd
- 4860 Wildlife Way
- 4559 Winder Hwy
- 4315 Marble Arch Way
- 4643 Wilderness Trail
- 0 Marble Arch Way
- 4202 Holcomb Cir
- 4116 Winder Hwy
- 4040 Winder Hwy
- 4713 Bedford Glen
- 4709 Bedford Glen
- 4721
- 4721 Bedford Glen
- 4724 Upper Berkshire Rd
- 4705 Bedford Glen
- 4728 Upper Berkshire Rd
- 4225 Winder Hwy
- 4247 Winder Hwy
- 4732 Upper Berkshire Rd
- 4732 Amsterdam Ln
- 0 Bedford Glen Unit 9063108
- 0 Bedford Glen Unit 3244844
- 4710 Bedford Glen
- 4734 Martin Rd
- 4718 Bedford Glen
- 4722 Bedford Glen