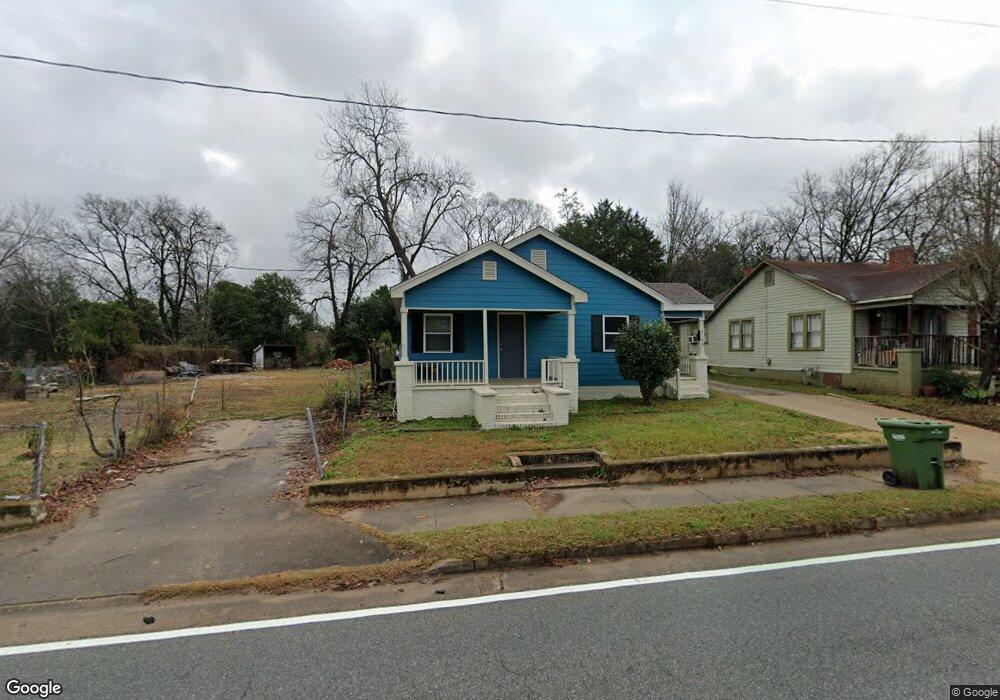
4108 2nd Ave Columbus, GA 31904
North Highlands NeighborhoodEstimated Value: $44,000 - $88,000
3
Beds
2
Baths
1,176
Sq Ft
$51/Sq Ft
Est. Value
About This Home
This home is located at 4108 2nd Ave, Columbus, GA 31904 and is currently estimated at $60,301, approximately $51 per square foot. 4108 2nd Ave is a home located in Muscogee County with nearby schools including Fox Elementary School, Double Churches Middle School, and Jordan Vocational High School.
Ownership History
Date
Name
Owned For
Owner Type
Purchase Details
Closed on
Dec 6, 2022
Sold by
Mears Randall
Bought by
Hernandez Garcia
Current Estimated Value
Purchase Details
Closed on
Sep 28, 2022
Sold by
Synovus Bank
Bought by
B & D Properties Llc
Purchase Details
Closed on
Nov 10, 2021
Sold by
Dockery Investments Llc
Bought by
Mears Randall Allen
Purchase Details
Closed on
Mar 14, 2014
Sold by
Dockery Investments Llc
Bought by
B & D Properties Llc
Purchase Details
Closed on
Sep 13, 2013
Sold by
Lendmark Financial Svcs In
Bought by
Dockery Investments Llc
Purchase Details
Closed on
May 10, 2013
Sold by
Lingo Ledon
Bought by
Lendmark Financial Svcs Inc
Create a Home Valuation Report for This Property
The Home Valuation Report is an in-depth analysis detailing your home's value as well as a comparison with similar homes in the area
Home Values in the Area
Average Home Value in this Area
Purchase History
We collect this data history from publicly available records. To have your information removed, we recommend requesting removal directly through your county’s website.
| Date | Buyer | Sale Price | Title Company |
|---|---|---|---|
| Hernandez Garcia | -- | -- | |
| B & D Properties Llc | -- | None Listed On Document | |
| Mears Randall Allen | $8,000 | -- | |
| B & D Properties Llc | $15,772 | -- | |
| Dockery Investments Llc | $15,000 | -- | |
| Lendmark Financial Svcs Inc | $36,180 | -- |
Source: Public Records
Tax History
| Year | Tax Paid | Tax Assessment Tax Assessment Total Assessment is a certain percentage of the fair market value that is determined by local assessors to be the total taxable value of land and additions on the property. | Land | Improvement |
|---|---|---|---|---|
| 2025 | $621 | $15,868 | $1,292 | $14,576 |
| 2024 | -- | $15,868 | $1,292 | $14,576 |
| 2023 | $473 | $12,016 | $4,236 | $7,780 |
| 2022 | $409 | $10,024 | $4,236 | $5,788 |
| 2021 | $409 | $10,024 | $4,236 | $5,788 |
| 2020 | $409 | $10,024 | $4,236 | $5,788 |
| 2019 | $411 | $10,024 | $4,236 | $5,788 |
| 2018 | $411 | $10,024 | $4,236 | $5,788 |
| 2017 | $412 | $10,024 | $4,236 | $5,788 |
| 2016 | $260 | $6,308 | $1,431 | $4,877 |
| 2015 | $261 | $6,308 | $1,431 | $4,877 |
| 2014 | $248 | $6,000 | $1,431 | $4,569 |
| 2013 | -- | $6,173 | $1,431 | $4,742 |
Source: Public Records
Map
Nearby Homes
Your Personal Tour Guide
Ask me questions while you tour the home.