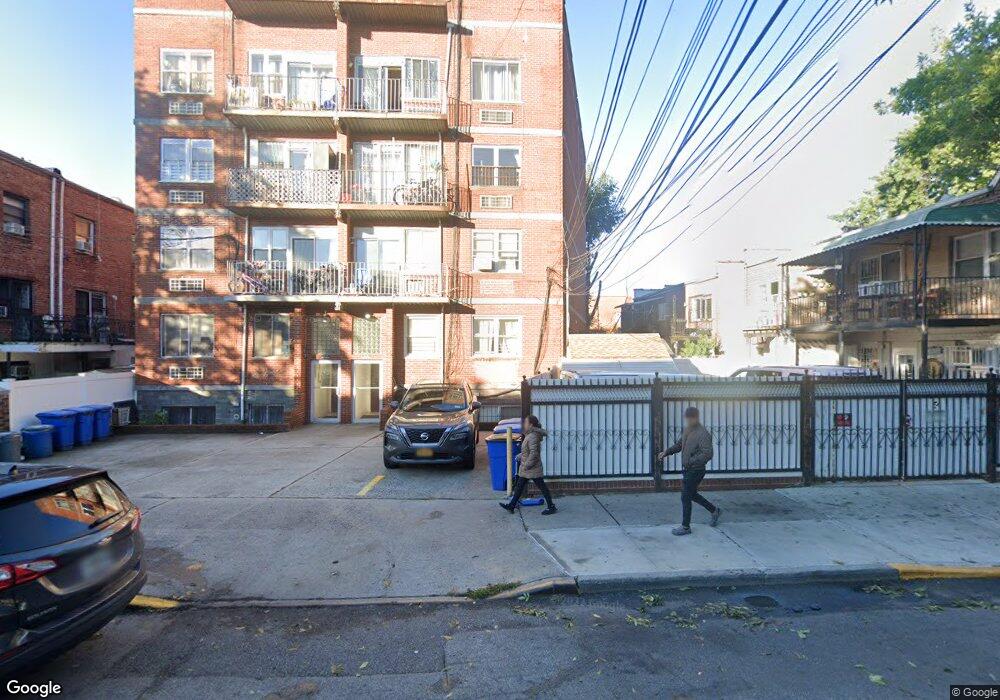
4108 97th Place Unit 3C Corona, NY 11368
Corona NeighborhoodEstimated Value: $256,000 - $362,000
--
Bed
--
Bath
506
Sq Ft
$652/Sq Ft
Est. Value
About This Home
This home is located at 4108 97th Place Unit 3C, Corona, NY 11368 and is currently estimated at $330,035, approximately $652 per square foot. 4108 97th Place Unit 3C is a home located in Queens County with nearby schools including P.S. 19 Marino Jeantet, Is 61 Leonardo Da Vinci, and John Bowne High School.
Ownership History
Date
Name
Owned For
Owner Type
Purchase Details
Closed on
Jun 12, 2019
Sold by
Wang Bing and Wang Kelly Bing
Bought by
Chu An-Ting
Current Estimated Value
Purchase Details
Closed on
Sep 10, 2015
Sold by
Wang Jianguo
Bought by
Wang Bing
Purchase Details
Closed on
Sep 25, 2014
Sold by
Huang Yan Qun
Bought by
Wang Jianguo
Purchase Details
Closed on
Dec 12, 2003
Sold by
Lau Chiu Ha and Mutlu Kerim
Bought by
Chen Xiu Hua
Home Financials for this Owner
Home Financials are based on the most recent Mortgage that was taken out on this home.
Original Mortgage
$100,000
Interest Rate
5.83%
Mortgage Type
Purchase Money Mortgage
Purchase Details
Closed on
Jul 31, 2001
Sold by
You Xiu Rong and Yau Xia Rong
Bought by
Lau Chiu Ha
Home Financials for this Owner
Home Financials are based on the most recent Mortgage that was taken out on this home.
Original Mortgage
$58,000
Interest Rate
7.16%
Create a Home Valuation Report for This Property
The Home Valuation Report is an in-depth analysis detailing your home's value as well as a comparison with similar homes in the area
Home Values in the Area
Average Home Value in this Area
Purchase History
| Date | Buyer | Sale Price | Title Company |
|---|---|---|---|
| Chu An-Ting | $312,000 | -- | |
| Wang Bing | -- | -- | |
| Wang Jianguo | $200,000 | -- | |
| Chen Xiu Hua | $168,000 | -- | |
| Lau Chiu Ha | -- | -- |
Source: Public Records
Mortgage History
| Date | Status | Borrower | Loan Amount |
|---|---|---|---|
| Previous Owner | Chen Xiu Hua | $100,000 | |
| Previous Owner | Lau Chiu Ha | $58,000 |
Source: Public Records
Tax History Compared to Growth
Tax History
| Year | Tax Paid | Tax Assessment Tax Assessment Total Assessment is a certain percentage of the fair market value that is determined by local assessors to be the total taxable value of land and additions on the property. | Land | Improvement |
|---|---|---|---|---|
| 2025 | $3,177 | $25,558 | $2,385 | $23,173 |
| 2024 | $3,177 | $25,411 | $2,385 | $23,026 |
| 2023 | $3,026 | $24,202 | $2,385 | $21,817 |
| 2022 | $2,041 | $25,962 | $2,385 | $23,577 |
| 2021 | $1,933 | $21,913 | $2,385 | $19,528 |
| 2020 | $1,885 | $23,910 | $2,385 | $21,525 |
| 2019 | $1,792 | $22,856 | $2,385 | $20,471 |
| 2018 | $2,353 | $18,503 | $2,385 | $16,118 |
| 2017 | $2,168 | $17,048 | $2,385 | $14,663 |
| 2016 | $2,105 | $17,048 | $2,385 | $14,663 |
| 2015 | $1,118 | $15,651 | $2,385 | $13,266 |
| 2014 | $1,118 | $14,963 | $2,386 | $12,577 |
Source: Public Records
Map
Nearby Homes
- 9628 41st Ave
- 97-28 41st Ave
- 40-48 97th St Unit 1B
- 4048 97th St Unit 3E
- 40-48 97th St Unit 3D
- 40-48 97th St Unit 2
- 97-10 43rd Ave
- 4035 97th St
- 40-42 Junction Blvd
- 40-45 99th St
- 95-20 41st Ave
- 95-13 42nd Ave
- 9905 43rd Ave Unit 2A
- 4131 95th St
- 4036 100th St
- 94-67 44th Ave
- 9465 44th Ave
- 40-4 97th St
- 9461 43rd Ave
- 100-04 Spruce St
- 4110 97th Place Unit 4D
- 4108 97th Place Unit 4C
- 4110 97th Place Unit 4B
- 4110 97th Place Unit 4A
- 4108 97th Place Unit 3D
- 4110 97th Place Unit 3B
- 4110 97th Place Unit 3A
- 4110 97th Place Unit 2B
- 4112 97th Place Unit 2A
- 4110 97th Place Unit 1B
- 4110 97th Place Unit 1A
- 4108 97th Place Unit 4D
- 4110 97th Place
- 4112 97th Place Unit 3B
- 4108 97th Place Unit 4C
- 41-08 97th Place Unit 4D
- 41-08 97th Place
- 4108 97th Place Unit 4D
- 4108 97th Place Unit 3C
- 4110 97th Place Unit 4D