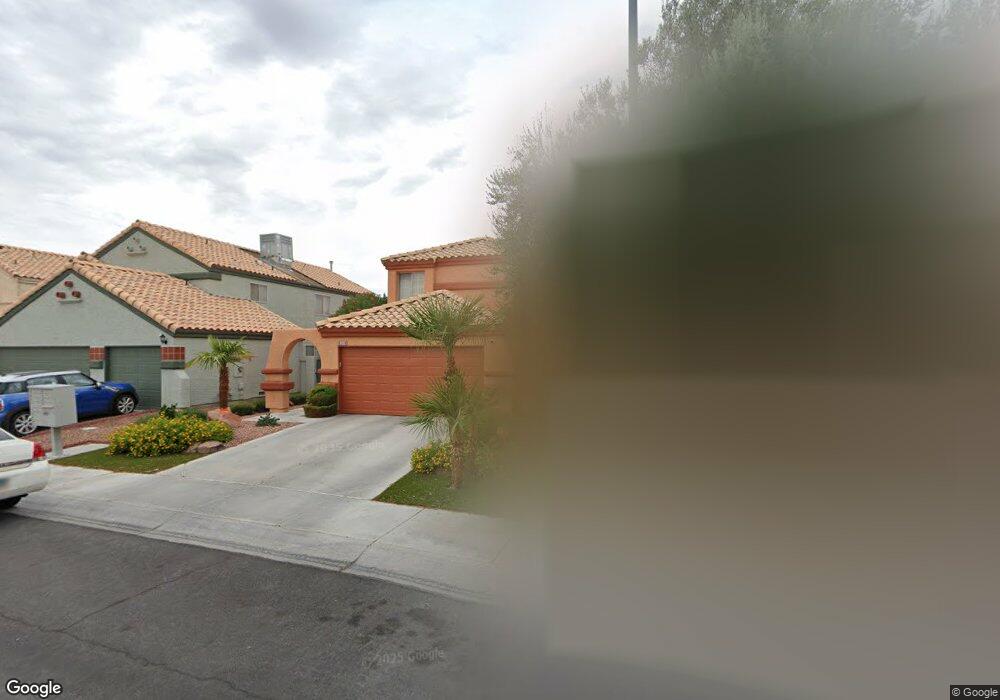
4108 Browndeer Cir Las Vegas, NV 89129
Lone Mountain NeighborhoodEstimated Value: $415,465 - $441,000
3
Beds
3
Baths
1,708
Sq Ft
$251/Sq Ft
Est. Value
About This Home
This home is located at 4108 Browndeer Cir, Las Vegas, NV 89129 and is currently estimated at $428,366, approximately $250 per square foot. 4108 Browndeer Cir is a home located in Clark County with nearby schools including Marc Kahre Elementary School, Dorothy Eisenberg Elementary School, and Justice Myron E Leavitt Middle School.
Ownership History
Date
Name
Owned For
Owner Type
Purchase Details
Closed on
Sep 3, 2004
Sold by
Smith Eric Ashley and Smith Julie
Bought by
Carter Mitchell E and Carter Marianne A
Current Estimated Value
Home Financials for this Owner
Home Financials are based on the most recent Mortgage that was taken out on this home.
Original Mortgage
$192,430
Outstanding Balance
$94,506
Interest Rate
5.75%
Mortgage Type
Unknown
Estimated Equity
$333,860
Purchase Details
Closed on
Jul 8, 2004
Sold by
Mchale Kevin M
Bought by
Smith Eric Ashley and Smith Julie
Home Financials for this Owner
Home Financials are based on the most recent Mortgage that was taken out on this home.
Original Mortgage
$192,430
Outstanding Balance
$94,506
Interest Rate
5.75%
Mortgage Type
Unknown
Estimated Equity
$333,860
Purchase Details
Closed on
Jun 26, 1996
Sold by
Savage Peter H
Bought by
Mchale Mcknight Judy E
Home Financials for this Owner
Home Financials are based on the most recent Mortgage that was taken out on this home.
Original Mortgage
$69,000
Interest Rate
8.32%
Create a Home Valuation Report for This Property
The Home Valuation Report is an in-depth analysis detailing your home's value as well as a comparison with similar homes in the area
Home Values in the Area
Average Home Value in this Area
Purchase History
| Date | Buyer | Sale Price | Title Company |
|---|---|---|---|
| Carter Mitchell E | $274,900 | Chicago Title | |
| Smith Eric Ashley | $221,000 | Ticor Title Of Nevada Inc | |
| Mchale Mcknight Judy E | $119,000 | Old Republic Title Company |
Source: Public Records
Mortgage History
| Date | Status | Borrower | Loan Amount |
|---|---|---|---|
| Open | Carter Mitchell E | $192,430 | |
| Previous Owner | Smith Eric Ashley | $176,800 | |
| Previous Owner | Mchale Mcknight Judy E | $69,000 | |
| Closed | Smith Eric Ashley | $33,150 | |
| Closed | Carter Mitchell E | $82,470 |
Source: Public Records
Tax History Compared to Growth
Tax History
| Year | Tax Paid | Tax Assessment Tax Assessment Total Assessment is a certain percentage of the fair market value that is determined by local assessors to be the total taxable value of land and additions on the property. | Land | Improvement |
|---|---|---|---|---|
| 2025 | $1,534 | $88,407 | $33,600 | $54,807 |
| 2024 | $1,490 | $88,407 | $33,600 | $54,807 |
| 2023 | $1,490 | $81,193 | $28,700 | $52,493 |
| 2022 | $1,447 | $72,645 | $24,150 | $48,495 |
| 2021 | $1,405 | $67,830 | $21,350 | $46,480 |
| 2020 | $1,361 | $55,341 | $21,000 | $34,341 |
| 2019 | $1,321 | $65,981 | $19,950 | $46,031 |
| 2018 | $1,283 | $59,869 | $15,400 | $44,469 |
| 2017 | $1,958 | $59,741 | $14,350 | $45,391 |
| 2016 | $1,216 | $53,945 | $10,500 | $43,445 |
| 2015 | $1,212 | $46,295 | $9,100 | $37,195 |
| 2014 | $1,177 | $39,891 | $5,950 | $33,941 |
Source: Public Records
Map
Nearby Homes
- 4109 Glenfield Cir
- 4061 Browndeer Cir
- 4053 Hazelridge Dr
- 7223 Hollywood Park Ave
- 4224 Perfect Drift St
- 7251 Daily Double Ave
- 4025 Cunning Fellow Ct
- 4025 Sea Hero St
- 4021 Sea Hero St Unit 1
- 3351 Dancing Waters St
- 3344 Dancing Waters St
- 3350 Dancing Waters St
- 4252 Olympic Point Dr
- 4052 Cape Sand Dr
- 4205 Thunder Twice St
- 4356 Perfect Drift St
- 6900 Quail Hollow Dr
- 7349 Dolphine Crest Ave
- 7408 Summer Crest Ln
- 7418 Lawrence Powers Ct
- 4112 Browndeer Cir Unit 4
- 4116 Browndeer Cir
- 4100 Browndeer Cir
- 4105 Glenfield Cir
- 4113 Glenfield Cir
- 4101 Glenfield Cir
- 4120 Browndeer Cir
- 4117 Glenfield Cir
- 4121 Glenfield Cir
- 4109 Browndeer Cir
- 4113 Browndeer Cir
- 4124 Browndeer Cir
- 4105 Browndeer Cir Unit 1
- 4105 Browndeer Cir
- 4117 Browndeer Cir
- 4068 Browndeer Cir
- 4101 Browndeer Cir
- 4121 Browndeer Cir
- 4128 Browndeer Cir
- 7137 Larkvale Way