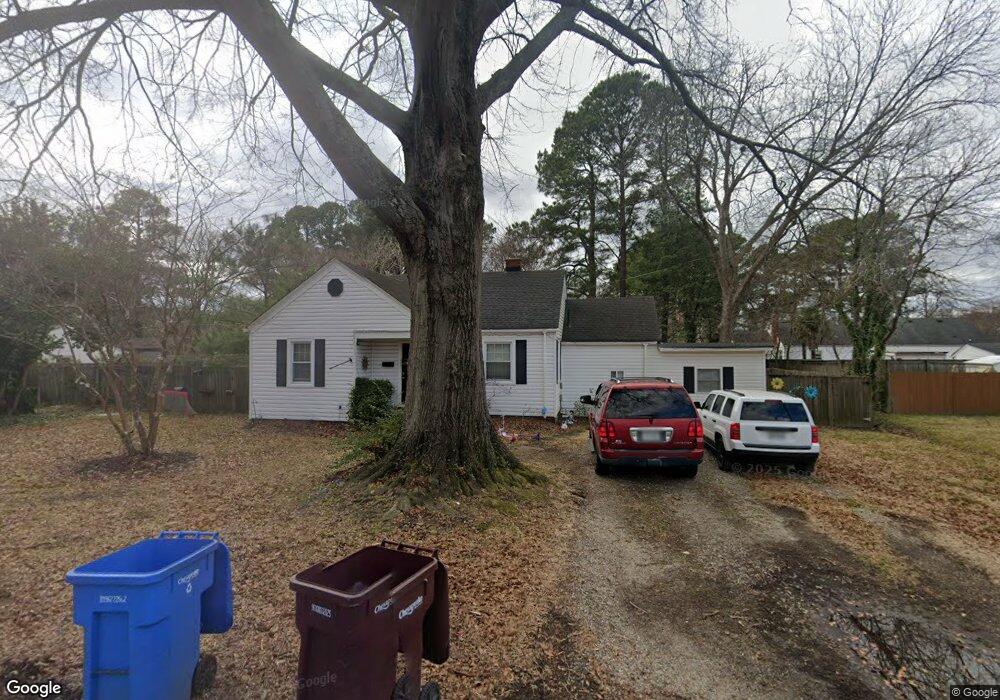
4108 Dyanax St Chesapeake, VA 23324
South Norfolk NeighborhoodEstimated Value: $254,000 - $293,000
3
Beds
2
Baths
1,352
Sq Ft
$206/Sq Ft
Est. Value
About This Home
This home is located at 4108 Dyanax St, Chesapeake, VA 23324 and is currently estimated at $278,611, approximately $206 per square foot. 4108 Dyanax St is a home located in Chesapeake City with nearby schools including Portlock Primary School, George W. Carver Intermediate School, and Oscar Smith Middle School.
Ownership History
Date
Name
Owned For
Owner Type
Purchase Details
Closed on
Jun 30, 2010
Sold by
Capps Joseph M
Bought by
Boggs Kenneth R and Meekins Heather D
Current Estimated Value
Home Financials for this Owner
Home Financials are based on the most recent Mortgage that was taken out on this home.
Original Mortgage
$144,000
Outstanding Balance
$95,976
Interest Rate
4.78%
Mortgage Type
New Conventional
Estimated Equity
$182,635
Purchase Details
Closed on
Dec 29, 2009
Sold by
Secy Of H U D
Bought by
Capps Joseph M
Purchase Details
Closed on
Mar 6, 2009
Sold by
Evans & Bryant Plc Sub Tr
Bought by
Secretary Of H U D
Purchase Details
Closed on
Aug 11, 2003
Sold by
Bennett Gary
Bought by
Ulassin Kyle
Home Financials for this Owner
Home Financials are based on the most recent Mortgage that was taken out on this home.
Original Mortgage
$113,913
Interest Rate
5.28%
Mortgage Type
VA
Purchase Details
Closed on
Feb 8, 1999
Sold by
Jarvis Patricia G
Bought by
Peterson William J
Home Financials for this Owner
Home Financials are based on the most recent Mortgage that was taken out on this home.
Original Mortgage
$67,300
Interest Rate
6.78%
Create a Home Valuation Report for This Property
The Home Valuation Report is an in-depth analysis detailing your home's value as well as a comparison with similar homes in the area
Home Values in the Area
Average Home Value in this Area
Purchase History
| Date | Buyer | Sale Price | Title Company |
|---|---|---|---|
| Boggs Kenneth R | $180,000 | -- | |
| Capps Joseph M | $100,000 | -- | |
| Secretary Of H U D | $169,942 | -- | |
| Ulassin Kyle | $112,000 | -- | |
| Peterson William J | $66,000 | -- |
Source: Public Records
Mortgage History
| Date | Status | Borrower | Loan Amount |
|---|---|---|---|
| Open | Boggs Kenneth R | $144,000 | |
| Previous Owner | Ulassin Kyle | $113,913 | |
| Previous Owner | Peterson William J | $67,300 |
Source: Public Records
Tax History Compared to Growth
Tax History
| Year | Tax Paid | Tax Assessment Tax Assessment Total Assessment is a certain percentage of the fair market value that is determined by local assessors to be the total taxable value of land and additions on the property. | Land | Improvement |
|---|---|---|---|---|
| 2025 | $2,047 | $214,300 | $115,000 | $99,300 |
| 2024 | $2,047 | $202,700 | $105,000 | $97,700 |
| 2023 | $1,669 | $186,100 | $95,000 | $91,100 |
| 2022 | $1,669 | $165,200 | $85,000 | $80,200 |
| 2021 | $1,460 | $139,000 | $60,000 | $79,000 |
| 2020 | $1,435 | $136,700 | $60,000 | $76,700 |
| 2019 | $1,412 | $134,500 | $60,000 | $74,500 |
| 2018 | $1,557 | $148,300 | $62,000 | $86,300 |
| 2017 | $1,557 | $148,300 | $62,000 | $86,300 |
| 2016 | $1,531 | $145,800 | $62,000 | $83,800 |
| 2015 | $1,531 | $145,800 | $62,000 | $83,800 |
| 2014 | $1,531 | $145,800 | $62,000 | $83,800 |
Source: Public Records
Map
Nearby Homes
- 4136 2nd St
- 4130 3rd St
- 1616 Eugenia Ave
- 602 Brickell Chase
- 1403 Freeman Ave
- 4348 Alvah Martin Way
- 436 Clemson Ave
- 605 Gendron St
- 0.21AC Freeman Ave
- 4121 Everett St
- 4159 Williamson St
- 904 Mckinley Ave
- 1035 Livingston Ave
- 424 Rutgers Ave
- 1201 Country Rd
- 1900 Varsity Dr
- 1819 Warfield St
- 2105 Portlock Rd
- 1244 Bell Tower Arch
- 1116 Kay Ave
- 4106 Dyanax St
- 4109 Bernard St
- 4110 Dyanax St
- 4107 Bernard St
- 4109 Dyanax St
- 4111 Bernard St
- 4107 Dyanax St
- 4104 Dyanax St
- 4111 Dyanax St
- 4105 Dyanax St
- 1204 Corden Ave
- 1206 Corden Ave
- 4108 Bernard St
- 4118 Franklin St
- 4114 Franklin St
- 4110 Bernard St
- 1202 Corden Ave
- 1208 Corden Ave
- 4120 Franklin St
- 4106 Bernard St