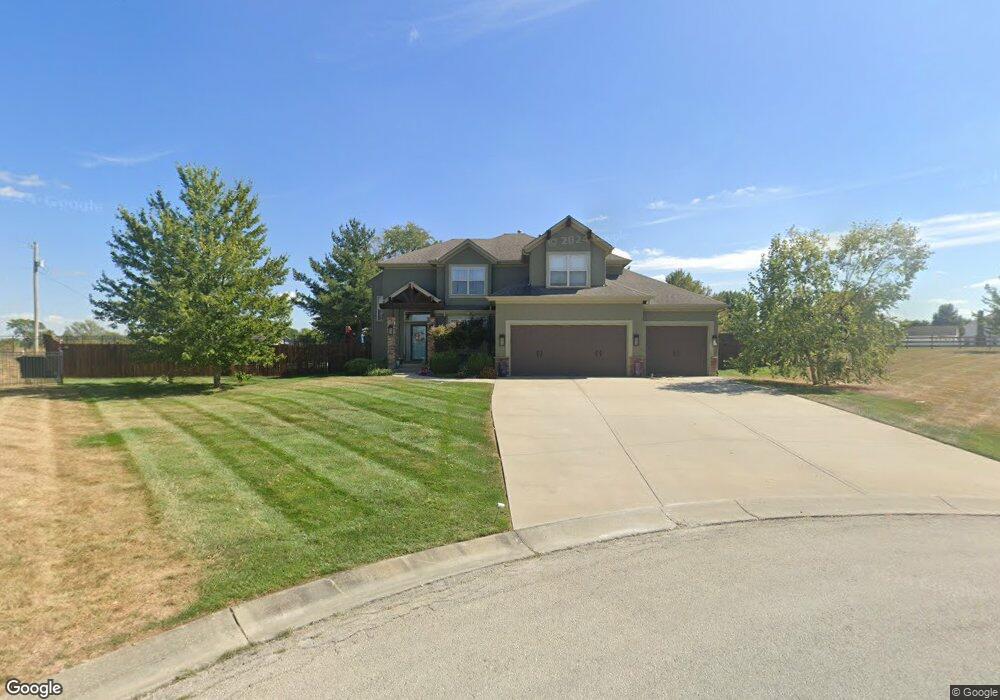
4108 SE Kyle Phillip Ct Blue Springs, MO 64014
Estimated Value: $506,000 - $605,000
4
Beds
4
Baths
2,505
Sq Ft
$220/Sq Ft
Est. Value
About This Home
This home is located at 4108 SE Kyle Phillip Ct, Blue Springs, MO 64014 and is currently estimated at $551,851, approximately $220 per square foot. 4108 SE Kyle Phillip Ct is a home located in Jackson County with nearby schools including Cordill-Mason Elementary School, Moreland Ridge Middle School, and Blue Springs South High School.
Ownership History
Date
Name
Owned For
Owner Type
Purchase Details
Closed on
Dec 19, 2016
Sold by
Brown Kevin L
Bought by
Brown Shelley L and Brown Shelley Lynn
Current Estimated Value
Home Financials for this Owner
Home Financials are based on the most recent Mortgage that was taken out on this home.
Original Mortgage
$267,200
Outstanding Balance
$218,510
Interest Rate
3.94%
Mortgage Type
New Conventional
Estimated Equity
$333,341
Purchase Details
Closed on
Mar 3, 2011
Sold by
Sallee Homes Inc
Bought by
Brown Kevin L and Brown Shelley Lynn
Home Financials for this Owner
Home Financials are based on the most recent Mortgage that was taken out on this home.
Original Mortgage
$170,000
Interest Rate
4.73%
Mortgage Type
New Conventional
Purchase Details
Closed on
Sep 27, 2010
Sold by
D Cam Development Llc
Bought by
Sallee Homes Inc
Home Financials for this Owner
Home Financials are based on the most recent Mortgage that was taken out on this home.
Original Mortgage
$279,862
Interest Rate
4.46%
Mortgage Type
Construction
Create a Home Valuation Report for This Property
The Home Valuation Report is an in-depth analysis detailing your home's value as well as a comparison with similar homes in the area
Home Values in the Area
Average Home Value in this Area
Purchase History
| Date | Buyer | Sale Price | Title Company |
|---|---|---|---|
| Brown Shelley L | -- | Alpha Title Llc | |
| Brown Kevin L | -- | Chicago | |
| Sallee Homes Inc | -- | Chicago |
Source: Public Records
Mortgage History
| Date | Status | Borrower | Loan Amount |
|---|---|---|---|
| Open | Brown Shelley L | $267,200 | |
| Closed | Brown Kevin L | $170,000 | |
| Previous Owner | Sallee Homes Inc | $279,862 |
Source: Public Records
Tax History Compared to Growth
Tax History
| Year | Tax Paid | Tax Assessment Tax Assessment Total Assessment is a certain percentage of the fair market value that is determined by local assessors to be the total taxable value of land and additions on the property. | Land | Improvement |
|---|---|---|---|---|
| 2025 | $6,828 | $95,796 | $15,027 | $80,769 |
| 2024 | $6,698 | $83,302 | $11,499 | $71,803 |
| 2023 | $6,698 | $83,302 | $13,222 | $70,080 |
| 2022 | $7,193 | $79,040 | $10,773 | $68,267 |
| 2021 | $7,186 | $79,040 | $10,773 | $68,267 |
| 2020 | $6,164 | $68,922 | $10,773 | $58,149 |
| 2019 | $5,961 | $68,922 | $10,773 | $58,149 |
| 2018 | $1,688,381 | $66,377 | $10,354 | $56,023 |
| 2017 | $5,803 | $66,377 | $10,354 | $56,023 |
| 2016 | $5,803 | $64,714 | $13,680 | $51,034 |
| 2014 | $5,197 | $57,950 | $13,680 | $44,270 |
Source: Public Records
Map
Nearby Homes
- 1401 SE Woodbine Dr
- 4008 SE Corey Nicole Place
- 28815 SE Moreland School Rd
- 908 SE Sienna Ct
- 4715 SE Lyne St
- 4716 SE Lyne St
- 4705 SE Claude Ct
- 4316 SE Adams Dr
- 4312 SE Adams Dr
- 4308 SE Adams Dr
- 4116 SE Adams Dr
- 3912 SE Adams Dr
- 4104 SE Adams Dr
- 4108 SE Adams Dr
- 1009 SE Auburn Ct
- 4113 SE Adams Dr
- 4109 SE Adams Dr
- 4313 SE Adams Dr
- 4209 SE Adams Dr
- 4708 SE Reda Ct
- 4104 SE Kyle Phillip Ct
- 4109 SE Kyle Phillip Ct
- 4100 SE Kyle Phillip Ct
- 4105 SE Kyle Phillip Ct
- 4101 SE Kyle Phillip Ct
- 1408 SE Woodbine Dr
- 1317 SE Wingate Cir
- 1421 SE Woodbine Dr
- 1404 SE Woodbine Dr
- 1417 SE Woodbine Dr
- 1413 SE Woodbine Dr
- 4104 SE Taylor Kristine Cir
- 1409 SE Woodbine Dr
- 4200 SE Wingate Dr
- 4108 SE Taylor Kristine Cir
- 1405 SE Woodbine Dr
- 1313 SE Wingate Cir
- 1400 SE Woodbine Dr
- 4109 SE Taylor Kristine Cir
- 1312 SE Wingate Cir