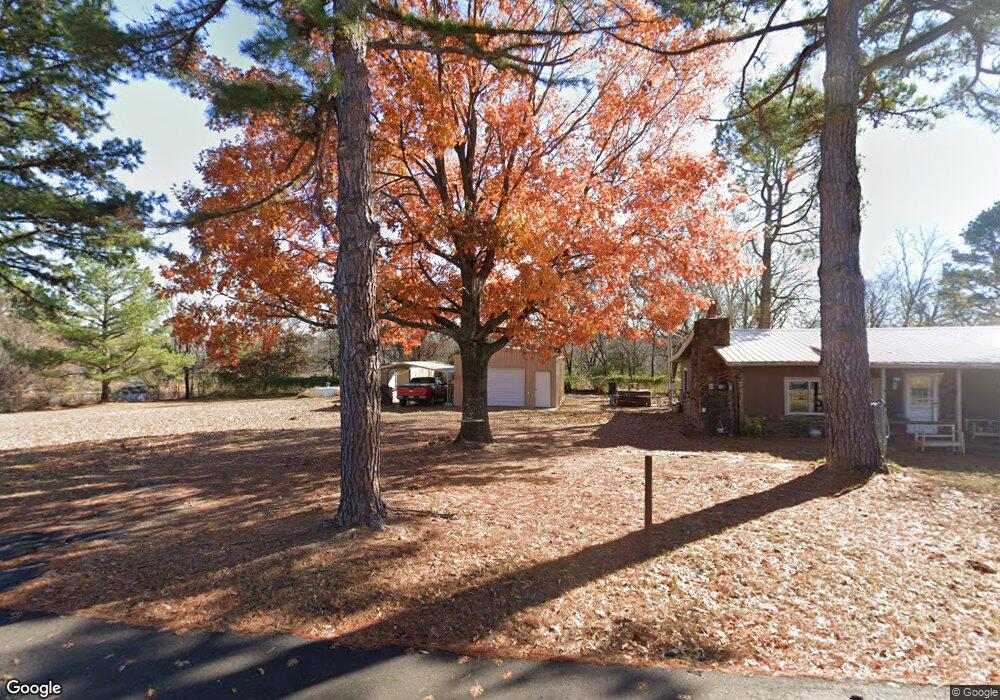
410840 E 1098 Rd Checotah, OK 74426
Estimated Value: $103,594 - $186,000
3
Beds
1
Bath
1,208
Sq Ft
$124/Sq Ft
Est. Value
About This Home
This home is located at 410840 E 1098 Rd, Checotah, OK 74426 and is currently estimated at $149,649, approximately $123 per square foot. 410840 E 1098 Rd is a home with nearby schools including Marshall Elementary School, Checotah Intermediate Elementary School, and Checotah Middle School.
Ownership History
Date
Name
Owned For
Owner Type
Purchase Details
Closed on
Oct 15, 2010
Sold by
Bryant Terry D and Bryant Krista M
Bought by
Thrower Larry R
Current Estimated Value
Home Financials for this Owner
Home Financials are based on the most recent Mortgage that was taken out on this home.
Original Mortgage
$36,253
Outstanding Balance
$23,903
Interest Rate
4.41%
Mortgage Type
Unknown
Estimated Equity
$125,746
Purchase Details
Closed on
Oct 21, 2005
Sold by
Mullin Everett and Mullin Sharon
Bought by
Bryant Terry D
Home Financials for this Owner
Home Financials are based on the most recent Mortgage that was taken out on this home.
Original Mortgage
$23,103
Interest Rate
5.69%
Mortgage Type
Purchase Money Mortgage
Purchase Details
Closed on
Nov 18, 1999
Sold by
Lampley
Bought by
Mullin
Purchase Details
Closed on
Jun 23, 1997
Sold by
Mosley
Bought by
Lampley
Create a Home Valuation Report for This Property
The Home Valuation Report is an in-depth analysis detailing your home's value as well as a comparison with similar homes in the area
Purchase History
| Date | Buyer | Sale Price | Title Company |
|---|---|---|---|
| Thrower Larry R | $44,000 | None Available | |
| Bryant Terry D | $19,219 | None Available | |
| Mullin | $12,000 | -- | |
| Lampley | $22,500 | -- |
Source: Public Records
Mortgage History
| Date | Status | Borrower | Loan Amount |
|---|---|---|---|
| Open | Thrower Larry R | $36,253 | |
| Previous Owner | Bryant Terry D | $23,103 |
Source: Public Records
Tax History
| Year | Tax Paid | Tax Assessment Tax Assessment Total Assessment is a certain percentage of the fair market value that is determined by local assessors to be the total taxable value of land and additions on the property. | Land | Improvement |
|---|---|---|---|---|
| 2025 | $494 | $6,593 | $880 | $5,713 |
| 2024 | $465 | $6,593 | $880 | $5,713 |
| 2023 | $465 | $6,215 | $880 | $5,335 |
| 2022 | $449 | $6,215 | $880 | $5,335 |
| 2021 | $495 | $6,215 | $880 | $5,335 |
| 2020 | $502 | $6,215 | $880 | $5,335 |
| 2019 | $498 | $6,215 | $880 | $5,335 |
| 2018 | $495 | $6,215 | $880 | $5,335 |
| 2017 | $479 | $6,086 | $880 | $5,206 |
| 2016 | $473 | $5,909 | $880 | $5,029 |
| 2015 | $403 | $5,181 | $880 | $4,301 |
| 2014 | $398 | $5,138 | $880 | $4,258 |
Source: Public Records
Map
Nearby Homes
- N 4110 Rd
- 410052 E 1103 Rd
- 000 Spencer Rd
- 409612 E 1115 Rd
- 411321 E 1080 Rd
- 409623 E 1115 Rd
- 116785 S 4214 Rd
- 413697 E 1090 Rd
- 107349 S 4091 Rd
- 0 1065 Rd Unit 2551189
- 0000 Highway 150
- 410800 E 1135 Rd
- TBD S 4110 Rd
- 415472 E 1073 Rd
- 0000 Oklahoma 150
- 414397 E 1074 Rd
- 114266 S 4110 Rd
- 109866 S 4155 Rd
- 64 3745
- 1 1120
- 410845 E 1098 Rd
- 410873 E 1099 Rd
- 410873 E 1099 Rd
- 410826 E 1099 Rd
- 410806 E 1098 Rd
- 2242 W 63rd St N
- 109655 S 4108 Rd
- 242 N 411 Rd
- 410910 E 1097 Rd
- 410585 E 1100 Rd
- 410598 E 1100 Rd
- 410709 E 1104 Rd
- 410884 E 1104 Rd
- 110255 S 4100 Rd
- 0 E 1104 Rd Unit 1149950
- 0 E 1104 Rd Unit 2417123
- 0 E 1104 Rd Unit 1107433
- 0 E 1104 Rd Unit 1113059
- 0 E 1104 Rd Unit 2412455
- S 4110 Rd