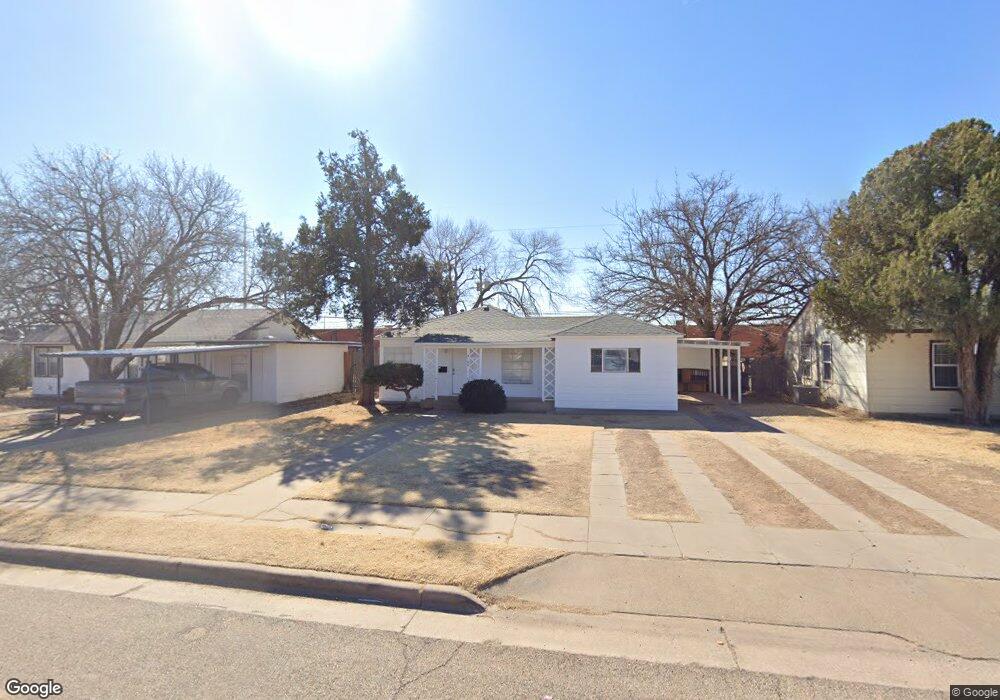
4109 33rd St Lubbock, TX 79410
Maxey Park NeighborhoodEstimated Value: $155,000 - $165,000
3
Beds
2
Baths
1,378
Sq Ft
$115/Sq Ft
Est. Value
About This Home
This home is located at 4109 33rd St, Lubbock, TX 79410 and is currently estimated at $158,529, approximately $115 per square foot. 4109 33rd St is a home located in Lubbock County with nearby schools including Overton Elementary School, Commander William C. McCool Academy, and Mackenzie Middle School.
Ownership History
Date
Name
Owned For
Owner Type
Purchase Details
Closed on
Jan 10, 2023
Sold by
Ross Karla
Bought by
Bmac Squared Investing Llc
Current Estimated Value
Home Financials for this Owner
Home Financials are based on the most recent Mortgage that was taken out on this home.
Original Mortgage
$125,800
Outstanding Balance
$116,854
Interest Rate
6.49%
Mortgage Type
New Conventional
Estimated Equity
$41,675
Purchase Details
Closed on
Dec 21, 2018
Sold by
Gonzalez Eduardo
Bought by
Ross Karla and Goddard Deck
Purchase Details
Closed on
Dec 20, 2018
Sold by
Boatwright Vera and Decker Boatwright Vera Mae
Bought by
Gozalez Eduardo
Purchase Details
Closed on
Sep 17, 2001
Sold by
Boatwright R Leroy
Bought by
Boatwright Vera M
Create a Home Valuation Report for This Property
The Home Valuation Report is an in-depth analysis detailing your home's value as well as a comparison with similar homes in the area
Home Values in the Area
Average Home Value in this Area
Purchase History
| Date | Buyer | Sale Price | Title Company |
|---|---|---|---|
| Bmac Squared Investing Llc | $125,800 | Service Title | |
| Ross Karla | -- | None Available | |
| Gozalez Eduardo | -- | None Available | |
| Boatwright Vera M | -- | -- |
Source: Public Records
Mortgage History
| Date | Status | Borrower | Loan Amount |
|---|---|---|---|
| Open | Bmac Squared Investing Llc | $125,800 |
Source: Public Records
Tax History Compared to Growth
Tax History
| Year | Tax Paid | Tax Assessment Tax Assessment Total Assessment is a certain percentage of the fair market value that is determined by local assessors to be the total taxable value of land and additions on the property. | Land | Improvement |
|---|---|---|---|---|
| 2025 | $1,955 | $98,696 | $23,500 | $75,196 |
| 2024 | $1,955 | $107,670 | $23,500 | $84,170 |
| 2023 | $1,692 | $91,035 | $10,980 | $80,055 |
| 2022 | $1,790 | $88,412 | $10,980 | $77,432 |
| 2021 | $1,335 | $62,335 | $10,980 | $51,355 |
| 2020 | $1,341 | $61,649 | $10,980 | $50,669 |
| 2019 | $1,392 | $61,993 | $10,980 | $51,013 |
| 2018 | $2,132 | $94,840 | $10,980 | $83,860 |
| 2017 | $1,941 | $86,218 | $10,980 | $75,238 |
| 2016 | $1,886 | $83,811 | $10,980 | $72,831 |
| 2015 | $369 | $77,622 | $10,980 | $66,642 |
| 2014 | $369 | $76,802 | $5,400 | $71,402 |
Source: Public Records
Map
Nearby Homes