Estimated Value: $441,000 - $471,000
3
Beds
2
Baths
2,004
Sq Ft
$230/Sq Ft
Est. Value
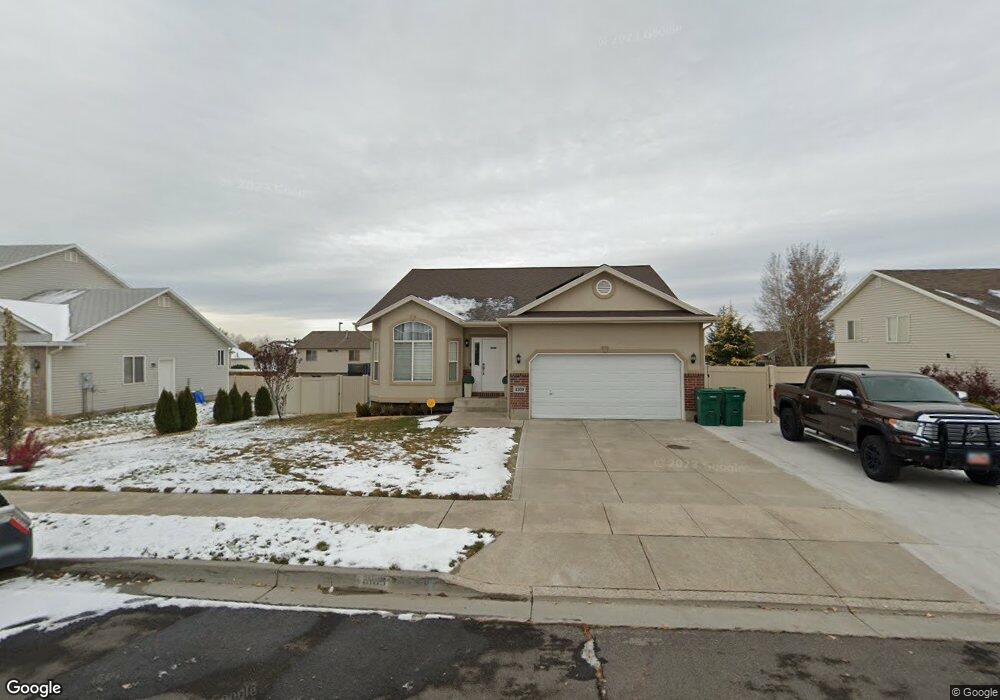
About This Home
This home is located at 4109 Lily Dr, Roy, UT 84067 and is currently estimated at $460,290, approximately $229 per square foot. 4109 Lily Dr is a home located in Weber County with nearby schools including Valley View School, Sand Ridge Junior High School, and Roy High School.
Ownership History
Date
Name
Owned For
Owner Type
Purchase Details
Closed on
Mar 7, 2019
Sold by
Fenn Spencer L
Bought by
Canyon Advantage Llc
Current Estimated Value
Purchase Details
Closed on
Dec 20, 2011
Sold by
Frandsen Scott S and Frandsen Cortney Dawn
Bought by
Fenn Spencer L
Home Financials for this Owner
Home Financials are based on the most recent Mortgage that was taken out on this home.
Original Mortgage
$6,700
Interest Rate
3.91%
Mortgage Type
Stand Alone Second
Purchase Details
Closed on
Sep 5, 2003
Sold by
Nilson & Co Inc
Bought by
Frandsen Scott S and Frandsen Cortney Dawn
Home Financials for this Owner
Home Financials are based on the most recent Mortgage that was taken out on this home.
Original Mortgage
$109,200
Interest Rate
6.06%
Mortgage Type
Purchase Money Mortgage
Create a Home Valuation Report for This Property
The Home Valuation Report is an in-depth analysis detailing your home's value as well as a comparison with similar homes in the area
Home Values in the Area
Average Home Value in this Area
Purchase History
| Date | Buyer | Sale Price | Title Company |
|---|---|---|---|
| Canyon Advantage Llc | -- | Title Guarantee River Park | |
| Fenn Spencer L | -- | Integrated Title Insurance S | |
| Frandsen Scott S | -- | Bonneville Title |
Source: Public Records
Mortgage History
| Date | Status | Borrower | Loan Amount |
|---|---|---|---|
| Previous Owner | Fenn Spencer L | $6,700 | |
| Previous Owner | Fenn Spencer L | $161,693 | |
| Previous Owner | Frandsen Scott S | $109,200 |
Source: Public Records
Tax History Compared to Growth
Tax History
| Year | Tax Paid | Tax Assessment Tax Assessment Total Assessment is a certain percentage of the fair market value that is determined by local assessors to be the total taxable value of land and additions on the property. | Land | Improvement |
|---|---|---|---|---|
| 2025 | $2,789 | $445,287 | $135,012 | $310,275 |
| 2024 | $2,668 | $235,399 | $74,256 | $161,143 |
| 2023 | $2,503 | $220,550 | $71,317 | $149,233 |
| 2022 | $2,661 | $242,550 | $60,501 | $182,049 |
| 2021 | $2,046 | $304,000 | $75,002 | $228,998 |
| 2020 | $2,000 | $274,000 | $75,002 | $198,998 |
| 2019 | $1,988 | $257,000 | $49,906 | $207,094 |
| 2018 | $1,818 | $220,000 | $44,976 | $175,024 |
| 2017 | $1,690 | $191,000 | $43,029 | $147,971 |
| 2016 | $1,623 | $98,579 | $24,773 | $73,806 |
| 2015 | $1,492 | $92,465 | $24,773 | $67,692 |
| 2014 | $1,293 | $77,633 | $21,944 | $55,689 |
Source: Public Records
Map
Nearby Homes
- 4118 Westlake Dr
- 4022 S 2725 W
- 2778 W 4175 S Unit 235
- 2777 W 4175 S Unit 229
- 4164 S 2400 W
- 2835 W 4200 S
- 2802 W 4375 S
- 3860 S Midland Dr Unit B97
- 3860 S Midland Dr Unit B59
- 3860 S Midland Dr Unit B 51
- 4110 S 2275 W
- 2816 W 4400 S
- 2642 W 4400 S
- 3860 Midland Dr Unit C10
- 3860 Midland Dr Unit B32
- 2195 W 4250 S
- 3750 S Midland Dr
- 3965 S 2225 W
- 4073 S 2175 W
- 2917 W 3970 S Unit 53
- 4095 Lily Dr
- 4123 Lily Dr
- 4090 Westlake Dr
- 4102 Westlake Dr
- 4070 Westlake Dr
- 4129 Lily Dr
- 4081 Lily Dr
- 4122 Lily Dr
- 4122 Lily Dr Unit 204
- 4094 Lily Dr
- 4060 Westlake Dr
- 4128 Lily Dr
- 4135 Lily Dr
- 4067 Lily Dr
- 4080 Lily Dr
- 4136 Westlake Dr
- 4134 Lily Dr
- 4134 Lily Dr Unit 206
- 4091 Westlake Dr
- 4141 Lily Dr