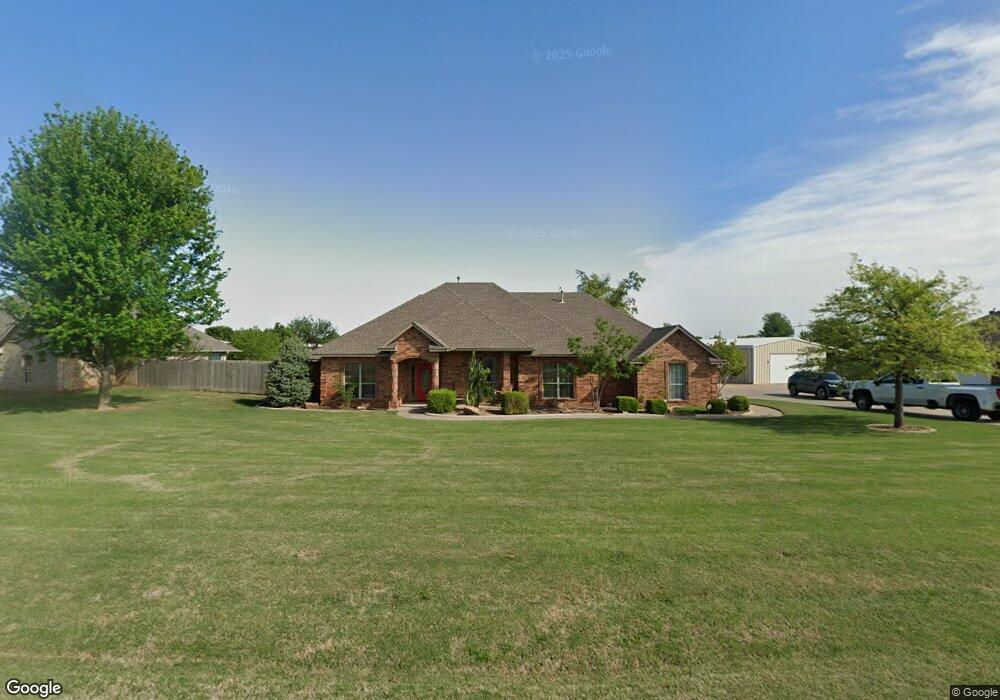
4109 Stardust Ln Tuttle, OK 73089
Estimated Value: $293,477 - $451,000
3
Beds
2
Baths
1,656
Sq Ft
$235/Sq Ft
Est. Value
About This Home
This home is located at 4109 Stardust Ln, Tuttle, OK 73089 and is currently estimated at $388,869, approximately $234 per square foot. 4109 Stardust Ln is a home located in Grady County with nearby schools including Tuttle Elementary School, Tuttle Intermediate School, and Tuttle Middle School.
Ownership History
Date
Name
Owned For
Owner Type
Purchase Details
Closed on
Aug 25, 2006
Sold by
Crimson Custom Homes Llc
Bought by
Link Charles Brian and Link Angela B
Current Estimated Value
Home Financials for this Owner
Home Financials are based on the most recent Mortgage that was taken out on this home.
Original Mortgage
$164,720
Outstanding Balance
$97,328
Interest Rate
6.47%
Mortgage Type
New Conventional
Estimated Equity
$291,541
Purchase Details
Closed on
May 24, 2005
Sold by
Price Dean and Price Jean
Bought by
Crimson Custom Homes Llc
Home Financials for this Owner
Home Financials are based on the most recent Mortgage that was taken out on this home.
Original Mortgage
$174,000
Interest Rate
5.87%
Mortgage Type
Purchase Money Mortgage
Create a Home Valuation Report for This Property
The Home Valuation Report is an in-depth analysis detailing your home's value as well as a comparison with similar homes in the area
Home Values in the Area
Average Home Value in this Area
Purchase History
| Date | Buyer | Sale Price | Title Company |
|---|---|---|---|
| Link Charles Brian | $206,000 | Stewart Abstract & Title Of | |
| Crimson Custom Homes Llc | $22,000 | None Available | |
| Crimson Custom Homes Llc | $22,000 | None Available |
Source: Public Records
Mortgage History
| Date | Status | Borrower | Loan Amount |
|---|---|---|---|
| Open | Link Charles Brian | $164,720 | |
| Previous Owner | Crimson Custom Homes Llc | $174,000 |
Source: Public Records
Tax History Compared to Growth
Tax History
| Year | Tax Paid | Tax Assessment Tax Assessment Total Assessment is a certain percentage of the fair market value that is determined by local assessors to be the total taxable value of land and additions on the property. | Land | Improvement |
|---|---|---|---|---|
| 2025 | $3,434 | $33,599 | $5,102 | $28,497 |
| 2024 | $3,592 | $32,620 | $4,954 | $27,666 |
| 2023 | $3,592 | $31,670 | $4,757 | $26,913 |
| 2022 | $3,268 | $30,748 | $5,915 | $24,833 |
| 2021 | $3,182 | $29,853 | $5,915 | $23,938 |
| 2020 | $3,242 | $30,088 | $5,915 | $24,173 |
| 2019 | $3,126 | $29,544 | $4,193 | $25,351 |
| 2018 | $2,909 | $29,125 | $4,193 | $24,932 |
| 2017 | $2,990 | $29,180 | $4,193 | $24,987 |
| 2016 | $2,953 | $28,331 | $3,710 | $24,621 |
| 2015 | $2,716 | $27,505 | $2,604 | $24,901 |
| 2014 | $2,716 | $27,506 | $2,420 | $25,086 |
Source: Public Records
Map
Nearby Homes
- 1441 Antler Ridge
- 1455 Deer Ridge Run
- 1418 Buckhorn Place
- 4121 Sambar St
- 4113 Sambar St
- 1409 Deer Ridge Run
- 1401 Deer Ridge Run
- 1425 Deer Ridge Run
- 1417 Deer Ridge Run
- 4053 Hart St
- 1136 Jozie Way
- 1120 Jozie Way
- 4333 Courtlyn Ave
- 1137 Jaden Blvd
- 1127 Deer Ridge
- 4220 Caribou St
- 5600 E Tyler Dr
- 4426 Violet St
- 4618 Riata Cir
- 1107 Prairie Hills Dr
- 4111 Stardust Ln
- 4107 Stardust Ln
- 4113 Stardust Ln
- 4108 Stardust Ln
- 4106 Stardust Ln
- 4105 Stardust Ln
- 4112 Stardust Ln
- 4114 Stardust Ln
- 4115 Stardust Ln
- 4110 Nugget Ln
- 4108 Nugget Ln
- 4104 Stardust Ln
- 4116 Stardust Ln
- 4112 Nugget Ln
- 1509 Stardust Ct
- 4106 Nugget Ln
- 4101 Stardust Ln
- 4117 Stardust Ln
- 4100 Stardust Ln
- 1455 Antler Ridge