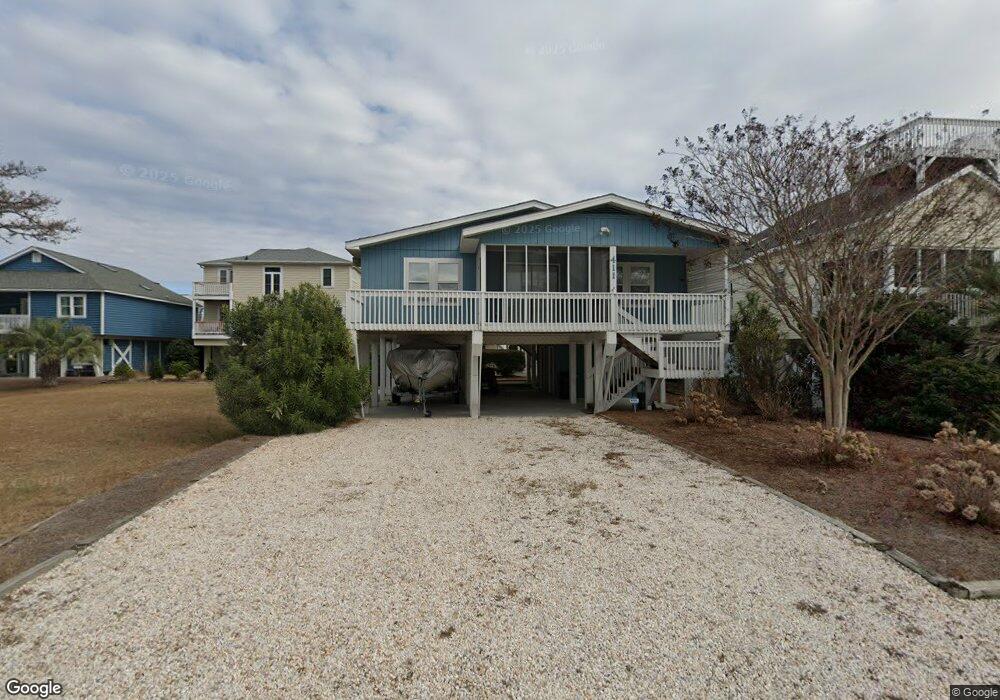
411 30th St Sunset Beach, NC 28468
Estimated Value: $677,212 - $785,000
4
Beds
2
Baths
1,296
Sq Ft
$569/Sq Ft
Est. Value
About This Home
This home is located at 411 30th St, Sunset Beach, NC 28468 and is currently estimated at $736,803, approximately $568 per square foot. 411 30th St is a home located in Brunswick County with nearby schools including Jessie Mae Monroe Elementary School, Shallotte Middle School, and West Brunswick High School.
Ownership History
Date
Name
Owned For
Owner Type
Purchase Details
Closed on
Dec 5, 2011
Sold by
Federal Home Loan Mortgage Corporation
Bought by
Hungerford Brian and Hungerford Bonnie
Current Estimated Value
Purchase Details
Closed on
Jul 19, 2011
Sold by
Smith Delos G and Smith Laura B
Bought by
Federal Home Loan Mortgage Corporation
Purchase Details
Closed on
Jan 11, 2007
Sold by
Smith Delos G and Smith Laura B
Bought by
Dlp Properties Llc
Purchase Details
Closed on
Oct 23, 2006
Sold by
Cox Mark E and Cox Mary Lebby
Bought by
Smith Delos G and Smith Laura B
Home Financials for this Owner
Home Financials are based on the most recent Mortgage that was taken out on this home.
Original Mortgage
$400,000
Interest Rate
6.39%
Mortgage Type
New Conventional
Create a Home Valuation Report for This Property
The Home Valuation Report is an in-depth analysis detailing your home's value as well as a comparison with similar homes in the area
Home Values in the Area
Average Home Value in this Area
Purchase History
| Date | Buyer | Sale Price | Title Company |
|---|---|---|---|
| Hungerford Brian | -- | None Available | |
| Federal Home Loan Mortgage Corporation | $405,138 | None Available | |
| Dlp Properties Llc | -- | None Available | |
| Smith Delos G | $500,000 | None Available |
Source: Public Records
Mortgage History
| Date | Status | Borrower | Loan Amount |
|---|---|---|---|
| Previous Owner | Smith Delos G | $400,000 |
Source: Public Records
Tax History
| Year | Tax Paid | Tax Assessment Tax Assessment Total Assessment is a certain percentage of the fair market value that is determined by local assessors to be the total taxable value of land and additions on the property. | Land | Improvement |
|---|---|---|---|---|
| 2025 | $2,944 | $546,700 | $240,000 | $306,700 |
| 2024 | $29 | $546,700 | $240,000 | $306,700 |
| 2023 | $2,084 | $546,700 | $240,000 | $306,700 |
| 2022 | $2,084 | $293,540 | $127,500 | $166,040 |
| 2021 | $2,084 | $293,540 | $127,500 | $166,040 |
| 2020 | $2,084 | $293,540 | $127,500 | $166,040 |
| 2019 | $2,084 | $127,500 | $127,500 | $0 |
| 2018 | $1,895 | $269,910 | $130,000 | $139,910 |
| 2017 | $1,866 | $130,000 | $130,000 | $0 |
| 2016 | $1,841 | $130,000 | $130,000 | $0 |
| 2015 | $1,841 | $269,910 | $130,000 | $139,910 |
| 2014 | $2,042 | $354,700 | $330,000 | $24,700 |
Source: Public Records
Map
Nearby Homes
Your Personal Tour Guide
Ask me questions while you tour the home.