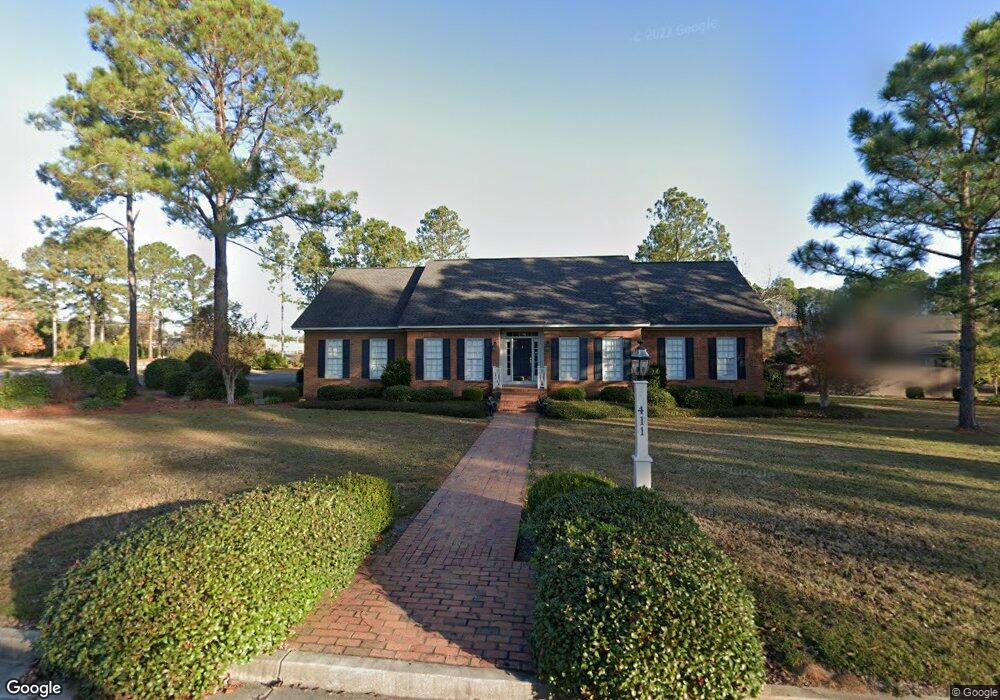
411 30th St W Tifton, GA 31794
Estimated Value: $372,000 - $504,000
3
Beds
3
Baths
2,612
Sq Ft
$167/Sq Ft
Est. Value
About This Home
This home is located at 411 30th St W, Tifton, GA 31794 and is currently estimated at $436,594, approximately $167 per square foot. 411 30th St W is a home located in Tift County with nearby schools including Len Lastinger Primary School, Charles Spencer Elementary School, and J.T. Reddick School.
Ownership History
Date
Name
Owned For
Owner Type
Purchase Details
Closed on
Jun 10, 2016
Sold by
Branch Kathryn W
Bought by
Joyner Sharmilee P and Joyner Casey R
Current Estimated Value
Home Financials for this Owner
Home Financials are based on the most recent Mortgage that was taken out on this home.
Original Mortgage
$150,000
Outstanding Balance
$67,122
Interest Rate
3.57%
Mortgage Type
New Conventional
Estimated Equity
$369,472
Purchase Details
Closed on
Dec 14, 2010
Sold by
Walker Eston L and Walker Barbara V
Bought by
Branch Kathryn W
Purchase Details
Closed on
Jun 21, 2000
Sold by
Walker Roger Constructio
Bought by
Walker Eston L
Purchase Details
Closed on
Apr 18, 2000
Sold by
Porter Catherine Tift
Bought by
Walker Roger Constructio
Purchase Details
Closed on
Jan 1, 1993
Sold by
Tift Thomas Willingham Estate
Bought by
Porter Catherine Tift
Create a Home Valuation Report for This Property
The Home Valuation Report is an in-depth analysis detailing your home's value as well as a comparison with similar homes in the area
Home Values in the Area
Average Home Value in this Area
Purchase History
| Date | Buyer | Sale Price | Title Company |
|---|---|---|---|
| Joyner Sharmilee P | $257,500 | -- | |
| Branch Kathryn W | -- | -- | |
| Walker Eston L | $26,700 | -- | |
| Walker Roger Constructio | $26,000 | -- | |
| Porter Catherine Tift | -- | -- |
Source: Public Records
Mortgage History
| Date | Status | Borrower | Loan Amount |
|---|---|---|---|
| Open | Joyner Sharmilee P | $150,000 |
Source: Public Records
Tax History Compared to Growth
Tax History
| Year | Tax Paid | Tax Assessment Tax Assessment Total Assessment is a certain percentage of the fair market value that is determined by local assessors to be the total taxable value of land and additions on the property. | Land | Improvement |
|---|---|---|---|---|
| 2024 | $4,148 | $153,840 | $20,000 | $133,840 |
| 2023 | $4,410 | $95,070 | $13,000 | $82,070 |
| 2022 | $3,578 | $95,070 | $13,000 | $82,070 |
| 2021 | $3,601 | $95,070 | $13,000 | $82,070 |
| 2020 | $3,691 | $95,070 | $13,000 | $82,070 |
| 2019 | $3,534 | $91,005 | $13,000 | $78,005 |
| 2018 | $3,535 | $91,005 | $13,000 | $78,005 |
| 2017 | $3,626 | $91,005 | $13,000 | $78,005 |
| 2016 | $3,632 | $91,005 | $13,000 | $78,005 |
| 2015 | $3,636 | $91,005 | $13,000 | $78,005 |
| 2014 | $3,641 | $91,005 | $13,000 | $78,005 |
| 2013 | -- | $91,004 | $13,000 | $78,004 |
Source: Public Records
Map
Nearby Homes
- 2609 Emmett Dr
- 0 US Highway 41 Unit 137727
- 4620 Murray Ave
- 2202 Emory Dr
- 2021 Emory Dr
- 2214 Love Ave
- 0 N U S Hwy 41
- 346 Somers Ln
- 1617 Wilson Ave N
- 714 44th St E
- 1601 Murray Ave
- 717 E 44th St
- 502 20th St E
- 2417 Belmont Ave
- 0 44th St E
- 1611 Love Ave
- 0 Central Ave Unit 138182
- 0 Central Ave Unit 137897
- 0 Central Ave Unit 137896
- 0 Central Ave Unit 137898
- 3006 Willingham Way
- 3008 Willingham Way
- 2805 Murray Ave
- 3002 Murray Ave
- 3002 Willingham Way
- 2808 Murray Ave
- 2814 Wilson Ave N
- 2806 Murray Ave
- 3011 Willingham Way
- 2803 Murray Ave
- 3007 Willingham Way
- 3009 Willingham Way
- 512 30th St W
- 2812 Wilson Ave N
- 3005 Willingham Way
- 2813 Wilson Ave N
- 2807 Hall Ave
- 3003 Willingham Way
- 411 28th St W
- 2803 Hall Ave