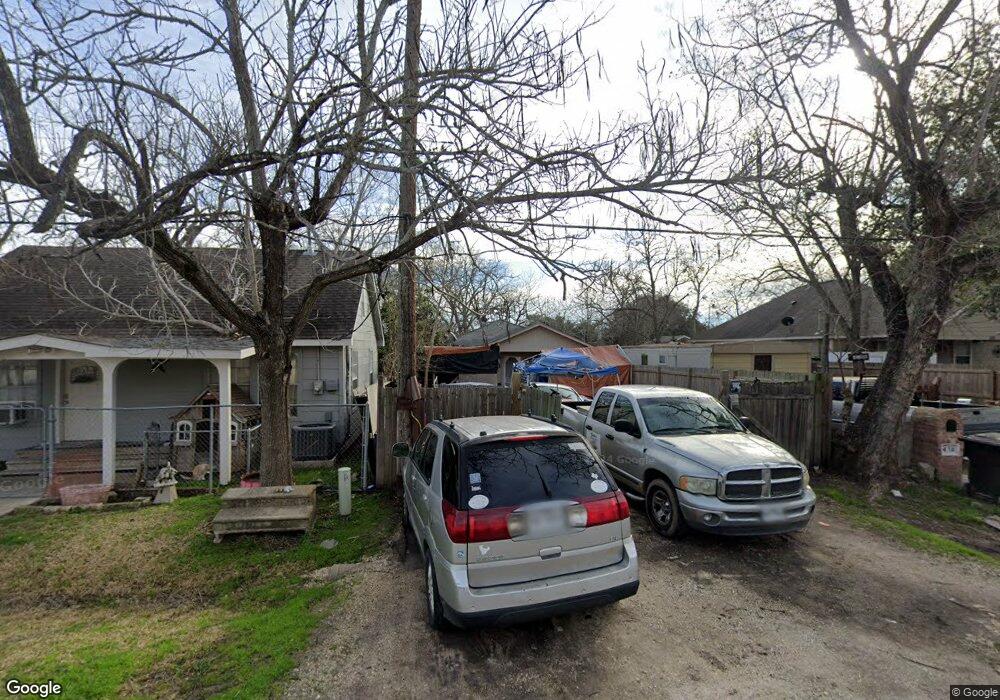
411 4th St Rosenberg, TX 77471
Estimated Value: $116,571 - $155,000
2
Beds
1
Bath
1,008
Sq Ft
$132/Sq Ft
Est. Value
About This Home
This home is located at 411 4th St, Rosenberg, TX 77471 and is currently estimated at $132,857, approximately $131 per square foot. 411 4th St is a home located in Fort Bend County with nearby schools including Jackson Elementary School, George Junior High School, and B.F. Terry High School.
Ownership History
Date
Name
Owned For
Owner Type
Purchase Details
Closed on
Jul 10, 2020
Sold by
Cervantes Vilma R
Bought by
Gennesaret Ventures Llc
Current Estimated Value
Purchase Details
Closed on
Oct 17, 2016
Sold by
Gennesaret Interests Llc
Bought by
Gennesaret Ventures Llc
Purchase Details
Closed on
Jun 19, 2015
Sold by
Cervantes Juan Garcia
Bought by
Gennesaret Interests Llc
Purchase Details
Closed on
Jun 5, 2008
Sold by
Cervantez Rafael Garcia and Cervantes Mary Isabeal
Bought by
Cervantes Juan Garcia and Cervantes John G
Create a Home Valuation Report for This Property
The Home Valuation Report is an in-depth analysis detailing your home's value as well as a comparison with similar homes in the area
Home Values in the Area
Average Home Value in this Area
Purchase History
| Date | Buyer | Sale Price | Title Company |
|---|---|---|---|
| Gennesaret Ventures Llc | -- | None Available | |
| Gennesaret Ventures Llc | -- | None Available | |
| Gennesaret Interests Llc | -- | None Available | |
| Cervantes Vilma & Gennesaret Ventures Llc | -- | -- | |
| Cervantes Juan Garcia | -- | None Available |
Source: Public Records
Tax History
| Year | Tax Paid | Tax Assessment Tax Assessment Total Assessment is a certain percentage of the fair market value that is determined by local assessors to be the total taxable value of land and additions on the property. | Land | Improvement |
|---|---|---|---|---|
| 2025 | $1,889 | $75,000 | $49,680 | $25,320 |
| 2024 | $1,889 | $100,000 | $49,680 | $50,320 |
| 2023 | $2,018 | $104,544 | $13,500 | $91,044 |
| 2022 | $1,278 | $62,420 | $13,500 | $48,920 |
| 2021 | $812 | $39,130 | $13,500 | $25,630 |
| 2020 | $819 | $38,570 | $13,500 | $25,070 |
| 2019 | $986 | $43,160 | $13,500 | $29,660 |
| 2018 | $772 | $33,260 | $4,650 | $28,610 |
| 2017 | $752 | $32,220 | $4,650 | $27,570 |
| 2016 | $753 | $32,260 | $4,650 | $27,610 |
| 2015 | $760 | $32,390 | $4,650 | $27,740 |
| 2014 | $769 | $32,400 | $4,650 | $27,750 |
Source: Public Records
Map
Nearby Homes
Your Personal Tour Guide
Ask me questions while you tour the home.