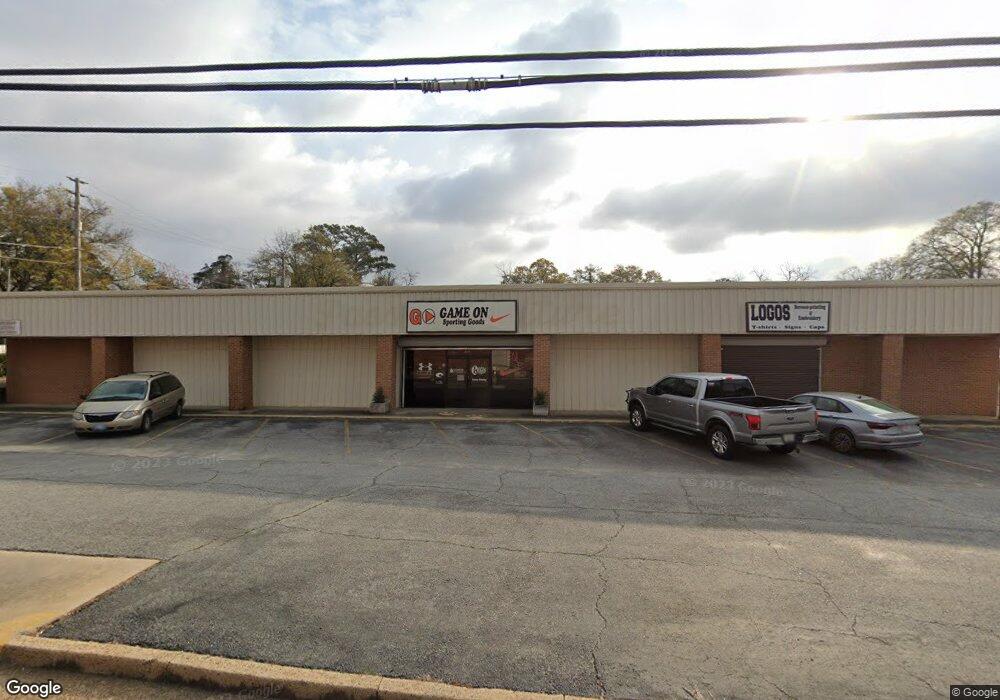
411 6th St S Cordele, GA 31015
Estimated Value: $470,158
Studio
--
Bath
10,800
Sq Ft
$44/Sq Ft
Est. Value
About This Home
This home is located at 411 6th St S, Cordele, GA 31015 and is currently estimated at $470,158, approximately $43 per square foot. 411 6th St S is a home located in Crisp County with nearby schools including Crisp County Elementary School, Crisp County Primary School, and Crisp County Middle School.
Ownership History
Date
Name
Owned For
Owner Type
Purchase Details
Closed on
Nov 3, 2010
Sold by
Wilkes Roger
Bought by
Oakatee Holdings Llc
Current Estimated Value
Home Financials for this Owner
Home Financials are based on the most recent Mortgage that was taken out on this home.
Original Mortgage
$117,173
Interest Rate
4.33%
Mortgage Type
Commercial
Purchase Details
Closed on
Nov 2, 2010
Sold by
Pass George
Bought by
Wilkes Roger
Home Financials for this Owner
Home Financials are based on the most recent Mortgage that was taken out on this home.
Original Mortgage
$117,173
Interest Rate
4.33%
Mortgage Type
Commercial
Purchase Details
Closed on
Jan 1, 2008
Sold by
Wilkes Roger
Bought by
Wilkes Roger
Purchase Details
Closed on
Jan 1, 2002
Sold by
Pass George
Bought by
Wilkes Roger
Purchase Details
Closed on
Oct 23, 1985
Bought by
Pass George
Purchase Details
Closed on
Dec 8, 1972
Bought by
Sheppard Johnnie W
Create a Home Valuation Report for This Property
The Home Valuation Report is an in-depth analysis detailing your home's value as well as a comparison with similar homes in the area
Purchase History
We collect this data history from publicly available records. To have your information removed, we recommend requesting removal directly through your county’s website.
| Date | Buyer | Sale Price | Title Company |
|---|---|---|---|
| Oakatee Holdings Llc | $172,500 | -- | |
| Wilkes Roger | -- | -- | |
| Wilkes Roger | $375,000 | -- | |
| Wilkes Roger | $190,000 | -- | |
| Pass George | $43,000 | -- | |
| Sheppard Johnnie W | -- | -- |
Source: Public Records
Mortgage History
We collect this data history from publicly available records. To have your information removed, we recommend requesting removal directly through your county’s website.
| Date | Status | Borrower | Loan Amount |
|---|---|---|---|
| Closed | Oakatee Holdings Llc | $117,173 |
Source: Public Records
Tax History
| Year | Tax Paid | Tax Assessment Tax Assessment Total Assessment is a certain percentage of the fair market value that is determined by local assessors to be the total taxable value of land and additions on the property. | Land | Improvement |
|---|---|---|---|---|
| 2025 | $2,636 | $74,732 | $16,560 | $58,172 |
| 2024 | $2,678 | $74,732 | $16,560 | $58,172 |
| 2023 | $2,802 | $74,732 | $16,560 | $58,172 |
| 2022 | $1,975 | $74,732 | $16,560 | $58,172 |
| 2021 | $1,936 | $74,732 | $16,560 | $58,172 |
| 2020 | $2,104 | $74,732 | $16,560 | $58,172 |
| 2019 | $2,120 | $74,732 | $16,560 | $58,172 |
| 2018 | $2,187 | $74,198 | $11,040 | $63,158 |
| 2017 | $3,013 | $74,198 | $11,040 | $63,158 |
| 2016 | $2,194 | $74,198 | $11,040 | $63,158 |
| 2015 | -- | $74,198 | $11,040 | $63,158 |
| 2014 | -- | $74,198 | $11,040 | $63,158 |
| 2013 | -- | $74,198 | $11,040 | $63,158 |
Source: Public Records
Map
Nearby Homes
- 312 E 14th Ave
- 551 N Cedar
- 315 E 12th Ave
- 610 E 15th Ave
- 2413 S Ga 41 Hwy
- 612 E 12th Ave
- 716 E 18th Ave
- 415 E 7th Ave
- 705 W 14th Ave
- 807 E 14th Ave
- 812 E 14th Ave
- 316 E 23rd Ave
- 710 W 17th Ave
- 720 E 20th Ave
- 211 E 5th Ave
- 1002 Camellia Dr
- 718 E 22nd Ave
- 709 Fleming Rd
- 511 E 25th Ave
- 1105 Camellia Dr
Your Personal Tour Guide
Ask me questions while you tour the home.