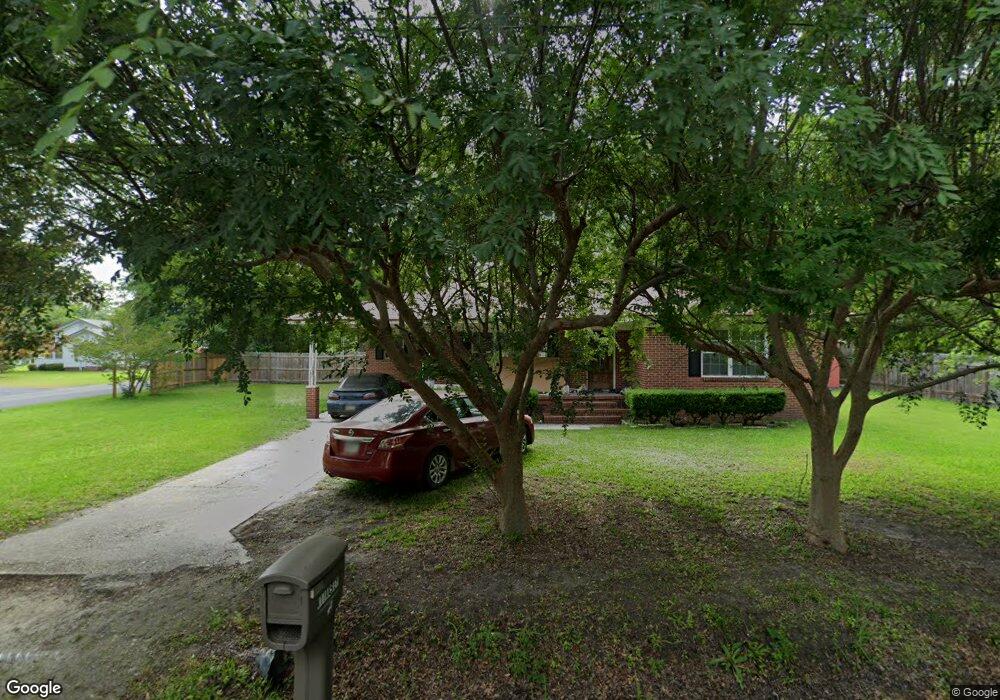
411 Abbey Place Nashville, GA 31639
Estimated Value: $126,000 - $142,000
3
Beds
1
Bath
1,324
Sq Ft
$104/Sq Ft
Est. Value
About This Home
This home is located at 411 Abbey Place, Nashville, GA 31639 and is currently estimated at $137,111, approximately $103 per square foot. 411 Abbey Place is a home located in Berrien County with nearby schools including Berrien Primary School, Berrien Elementary School, and Berrien Middle School.
Ownership History
Date
Name
Owned For
Owner Type
Purchase Details
Closed on
Jan 30, 2015
Sold by
Federal National Mortgage Association
Bought by
Sandoval Alejandro
Current Estimated Value
Purchase Details
Closed on
Oct 7, 2014
Sold by
Brown Kenneth Terry
Bought by
Federal National Mtg Associati
Purchase Details
Closed on
Apr 25, 2005
Sold by
Huffstickler Amanda
Bought by
Brown Kenneth Terry and Brown Sonya E
Home Financials for this Owner
Home Financials are based on the most recent Mortgage that was taken out on this home.
Original Mortgage
$53,970
Interest Rate
10%
Mortgage Type
New Conventional
Purchase Details
Closed on
Sep 25, 2002
Sold by
Tomlinson Beulah
Bought by
Huffstickler Amanda
Purchase Details
Closed on
Apr 5, 2000
Sold by
Bruce Barbara Mcgil
Bought by
Tomlinson Beulah
Purchase Details
Closed on
Sep 12, 1994
Sold by
Mcgill Mary Mildred
Bought by
Bruce Barbara Mcgil
Purchase Details
Closed on
Jan 26, 1957
Bought by
Mcgill Mary Mildred
Create a Home Valuation Report for This Property
The Home Valuation Report is an in-depth analysis detailing your home's value as well as a comparison with similar homes in the area
Home Values in the Area
Average Home Value in this Area
Purchase History
| Date | Buyer | Sale Price | Title Company |
|---|---|---|---|
| Sandoval Alejandro | -- | -- | |
| Federal National Mtg Associati | $80,121 | -- | |
| Brown Kenneth Terry | $63,500 | -- | |
| Huffstickler Amanda | $56,000 | -- | |
| Tomlinson Beulah | $49,500 | -- | |
| Bruce Barbara Mcgil | -- | -- | |
| Mcgill Mary Mildred | -- | -- |
Source: Public Records
Mortgage History
| Date | Status | Borrower | Loan Amount |
|---|---|---|---|
| Previous Owner | Brown Kenneth Terry | $53,970 |
Source: Public Records
Tax History Compared to Growth
Tax History
| Year | Tax Paid | Tax Assessment Tax Assessment Total Assessment is a certain percentage of the fair market value that is determined by local assessors to be the total taxable value of land and additions on the property. | Land | Improvement |
|---|---|---|---|---|
| 2024 | $1,114 | $27,304 | $1,838 | $25,466 |
| 2023 | $1,118 | $27,304 | $1,838 | $25,466 |
| 2022 | $1,118 | $27,304 | $1,838 | $25,466 |
| 2021 | $864 | $27,304 | $1,837 | $25,467 |
| 2020 | $866 | $27,304 | $1,838 | $25,466 |
| 2019 | $866 | $27,304 | $1,838 | $25,466 |
| 2018 | $1,060 | $27,304 | $1,838 | $25,466 |
| 2017 | $802 | $27,304 | $1,838 | $25,466 |
| 2016 | $792 | $27,698 | $1,838 | $25,860 |
| 2015 | -- | $27,697 | $1,838 | $25,860 |
| 2014 | -- | $27,725 | $1,838 | $25,888 |
| 2013 | -- | $27,888 | $2,000 | $25,888 |
Source: Public Records
Map
Nearby Homes
- 409 Abby St
- 205 S Dogwood Dr Unit K
- 309 S Dogwood Dr
- 307 Gaskins St
- 602 S Berrien St
- 514 W Mcpherson Ave
- 612 W Dennis Ave
- .73AC Davis St
- 805 S Berrien St
- 102 W Avera Ave
- 624 W Washington Ave
- 213 Chism Ave
- 301 Kirby Cir
- 713 Pall Mall Place
- 208 N Bullard St Unit A/ B
- 203 Guest Cir
- 201 Beetree Ave
- 205 Beetree Ave
- 501 E 7th Ave
- 603 N Jackson St
- 409 Abbey Place
- 304 Gary Ave
- 306 Gary Ave
- 502 College St
- 506 College St
- 412 S Berrien St
- 509 College St
- 304 W Dennis Ave
- 404 S Berrien St
- 402 S Berrien St
- 308 Gary Ave
- 510 College St
- 503 S Bartow St
- 302 W Dennis Ave
- 509 S Bartow St
- 513 College St
- 400 S Berrien St
- 409 S Berrien St
- 407 S Berrien St
- 614 Howard St