Estimated Value: $148,755 - $164,000
3
Beds
1
Bath
816
Sq Ft
$194/Sq Ft
Est. Value
About This Home
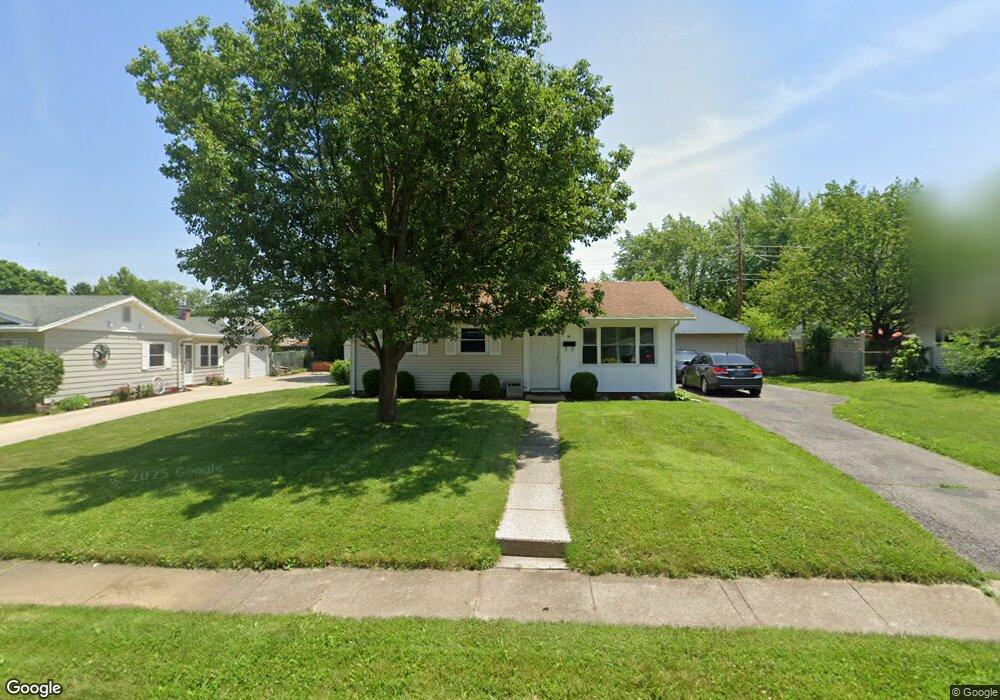
This home is located at 411 Ackerman Place, Xenia, OH 45385 and is currently estimated at $158,439, approximately $194 per square foot. 411 Ackerman Place is a home located in Greene County with nearby schools including Xenia High School, Summit Academy Community School for Alternative Learners - Xenia, and Legacy Christian Academy.
Ownership History
Date
Name
Owned For
Owner Type
Purchase Details
Closed on
Apr 14, 2021
Sold by
Hartley Derek B and Hartley Misty N
Bought by
Hartley Derek B and Hartley Misty N
Current Estimated Value
Home Financials for this Owner
Home Financials are based on the most recent Mortgage that was taken out on this home.
Original Mortgage
$82,500
Outstanding Balance
$68,340
Interest Rate
3.05%
Mortgage Type
New Conventional
Estimated Equity
$90,099
Purchase Details
Closed on
Aug 31, 2009
Sold by
Hartley Robert and Hartley Sharon
Bought by
Hartley Derek B
Home Financials for this Owner
Home Financials are based on the most recent Mortgage that was taken out on this home.
Original Mortgage
$78,551
Interest Rate
5.27%
Mortgage Type
FHA
Purchase Details
Closed on
Feb 20, 2008
Sold by
Hud
Bought by
Hartley Sharon and Hartley Robert
Purchase Details
Closed on
Jun 14, 2007
Sold by
Pollock Randy
Bought by
Hud
Purchase Details
Closed on
Jan 18, 1995
Sold by
Willard R Bartlett Trst
Bought by
Pollock Randy R
Home Financials for this Owner
Home Financials are based on the most recent Mortgage that was taken out on this home.
Original Mortgage
$58,028
Interest Rate
9.2%
Mortgage Type
New Conventional
Create a Home Valuation Report for This Property
The Home Valuation Report is an in-depth analysis detailing your home's value as well as a comparison with similar homes in the area
Home Values in the Area
Average Home Value in this Area
Purchase History
| Date | Buyer | Sale Price | Title Company |
|---|---|---|---|
| Hartley Derek B | -- | Homeland Title | |
| Hartley Derek B | $80,000 | Attorney | |
| Hartley Sharon | $46,000 | None Available | |
| Hud | $64,000 | None Available | |
| Pollock Randy R | $57,000 | -- |
Source: Public Records
Mortgage History
| Date | Status | Borrower | Loan Amount |
|---|---|---|---|
| Open | Hartley Derek B | $82,500 | |
| Closed | Hartley Derek B | $78,551 | |
| Previous Owner | Pollock Randy R | $58,028 |
Source: Public Records
Tax History Compared to Growth
Tax History
| Year | Tax Paid | Tax Assessment Tax Assessment Total Assessment is a certain percentage of the fair market value that is determined by local assessors to be the total taxable value of land and additions on the property. | Land | Improvement |
|---|---|---|---|---|
| 2024 | $1,410 | $32,940 | $9,400 | $23,540 |
| 2023 | $1,410 | $32,940 | $9,400 | $23,540 |
| 2022 | $1,170 | $23,320 | $6,710 | $16,610 |
| 2021 | $1,186 | $23,320 | $6,710 | $16,610 |
| 2020 | $1,136 | $23,320 | $6,710 | $16,610 |
| 2019 | $1,089 | $21,050 | $4,600 | $16,450 |
| 2018 | $1,094 | $21,050 | $4,600 | $16,450 |
| 2017 | $1,051 | $21,050 | $4,600 | $16,450 |
| 2016 | $1,052 | $19,870 | $4,600 | $15,270 |
| 2015 | $1,055 | $19,870 | $4,600 | $15,270 |
| 2014 | $1,010 | $19,870 | $4,600 | $15,270 |
Source: Public Records
Map
Nearby Homes
- 399 Ackerman Place
- 392 Antrim Rd
- 406 Antrim Rd
- 380 Antrim Rd
- 435 Ackerman Place
- 416 Antrim Rd
- 412 Ackerman Place
- 398 Ackerman Place
- 890 Parnell Dr
- 428 Ackerman Place
- 428 Antrim Rd
- 386 Ackerman Place
- 447 Ackerman Place
- 444 Ackerman Place
- 440 Antrim Rd
- 958 Parnell Dr
- 383 Antrim Rd
- 407 Antrim Rd
- 468 Antrim Rd
- 459 Ackerman Place