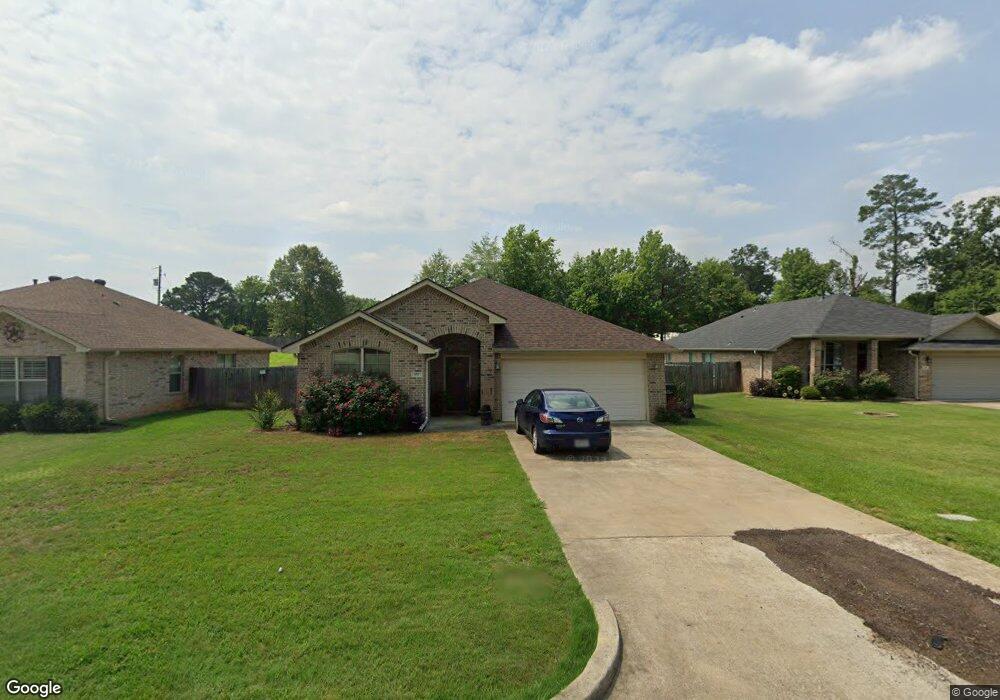
411 Alta St Longview, TX 75604
Estimated Value: $256,000 - $296,000
Studio
3
Baths
1,489
Sq Ft
$180/Sq Ft
Est. Value
About This Home
This home is located at 411 Alta St, Longview, TX 75604 and is currently estimated at $268,519, approximately $180 per square foot. 411 Alta St is a home located in Gregg County with nearby schools including Spring Hill Primary School, Spring Hill Intermediate School, and Spring Hill Junior High School.
Ownership History
Date
Name
Owned For
Owner Type
Purchase Details
Closed on
Feb 28, 2013
Sold by
Sullins Krista
Bought by
Estes Shawna E
Current Estimated Value
Home Financials for this Owner
Home Financials are based on the most recent Mortgage that was taken out on this home.
Original Mortgage
$93,000
Outstanding Balance
$65,102
Interest Rate
3.44%
Mortgage Type
New Conventional
Estimated Equity
$203,417
Purchase Details
Closed on
Apr 23, 2010
Sold by
Conaway & Sons Ltd
Bought by
Sullins Krista and Sullins David
Home Financials for this Owner
Home Financials are based on the most recent Mortgage that was taken out on this home.
Original Mortgage
$159,906
Interest Rate
4.91%
Mortgage Type
Purchase Money Mortgage
Purchase Details
Closed on
Sep 4, 2009
Sold by
Kyle Patricia A and Kyle Patricia
Bought by
Conaway & Sons Ltd
Create a Home Valuation Report for This Property
The Home Valuation Report is an in-depth analysis detailing your home's value as well as a comparison with similar homes in the area
Purchase History
| Date | Buyer | Sale Price | Title Company |
|---|---|---|---|
| Estes Shawna E | -- | Ctc | |
| Matte Krista | -- | Ctc | |
| Sullins Krista | -- | None Available | |
| Conaway & Sons Ltd | -- | None Available |
Source: Public Records
Mortgage History
| Date | Status | Borrower | Loan Amount |
|---|---|---|---|
| Open | Matte Krista | $93,000 | |
| Closed | Estes Shawna E | $93,000 | |
| Previous Owner | Sullins Krista | $159,906 |
Source: Public Records
Tax History Compared to Growth
Tax History
| Year | Tax Paid | Tax Assessment Tax Assessment Total Assessment is a certain percentage of the fair market value that is determined by local assessors to be the total taxable value of land and additions on the property. | Land | Improvement |
|---|---|---|---|---|
| 2025 | $2,705 | $250,380 | $39,600 | $210,780 |
| 2024 | $46 | $243,960 | $39,600 | $204,360 |
| 2023 | $4,156 | $210,950 | $20,000 | $190,950 |
| 2022 | $4,192 | $178,370 | $20,000 | $158,370 |
| 2021 | $3,958 | $166,700 | $20,000 | $146,700 |
| 2020 | $3,941 | $164,900 | $20,000 | $144,900 |
| 2019 | $3,998 | $163,690 | $20,000 | $143,690 |
| 2018 | $2,991 | $162,450 | $20,000 | $142,450 |
| 2017 | $4,012 | $164,260 | $20,000 | $144,260 |
| 2016 | $4,015 | $164,370 | $20,000 | $144,370 |
| 2015 | $2,993 | $159,440 | $20,000 | $139,440 |
| 2014 | -- | $159,740 | $20,000 | $139,740 |
Source: Public Records
Map
Nearby Homes
- 409 Alta St
- 413 Alta St
- 407 Alta St
- 407 Alta St Unit St.
- 415 Alta St
- 410 Alta St
- 301 Delmar St
- 412 Alta St
- 3803 Killingsworth Cir
- 408 Alta St
- 3801 Killingsworth Cir
- 3805 Killingsworth Cir
- 404 Alta St
- 402 Alta St
- 3807 3807 Killingsworth Dr
- 3802 French Dr
- 3807 Killingsworth Cir
- 3809 Killingsworth Cir
- 3800 French Dr
- 400 Alta St