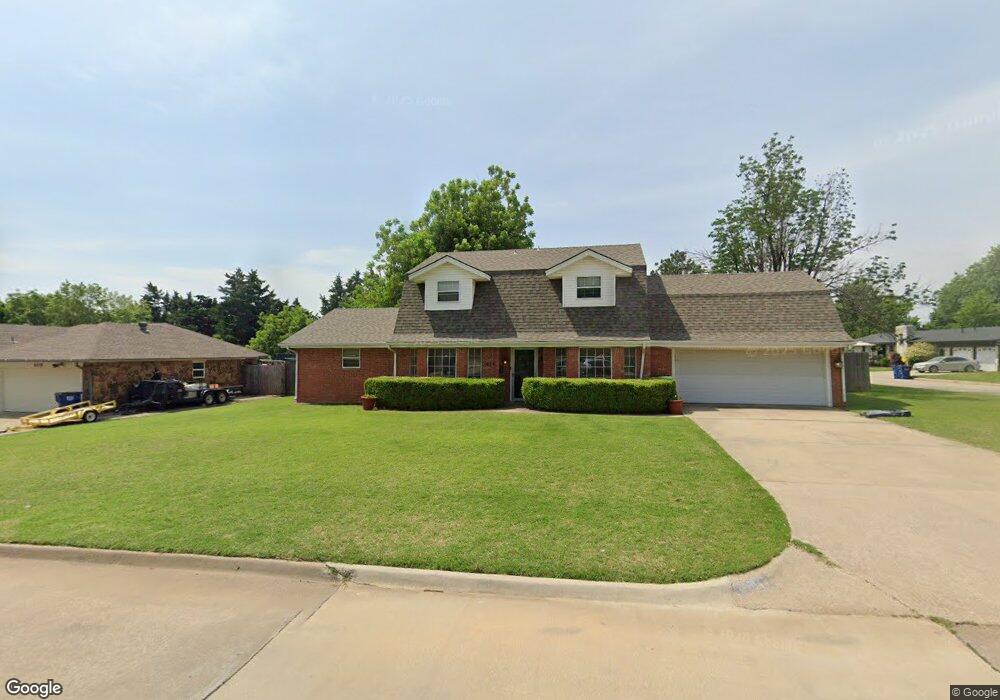
411 Amity Ln El Reno, OK 73036
Estimated Value: $232,100 - $252,000
3
Beds
2
Baths
2,200
Sq Ft
$109/Sq Ft
Est. Value
About This Home
This home is located at 411 Amity Ln, El Reno, OK 73036 and is currently estimated at $239,775, approximately $108 per square foot. 411 Amity Ln is a home located in Canadian County with nearby schools including Hillcrest Elementary School, Lincoln Learning Center, and Rose Witcher Elementary School.
Ownership History
Date
Name
Owned For
Owner Type
Purchase Details
Closed on
Oct 19, 2007
Sold by
Delong Jim L
Bought by
Spears Shawna M
Current Estimated Value
Home Financials for this Owner
Home Financials are based on the most recent Mortgage that was taken out on this home.
Original Mortgage
$152,757
Outstanding Balance
$95,911
Interest Rate
6.32%
Estimated Equity
$143,864
Purchase Details
Closed on
Nov 27, 2002
Sold by
Dailey Sharon
Home Financials for this Owner
Home Financials are based on the most recent Mortgage that was taken out on this home.
Original Mortgage
$75,000
Interest Rate
6.28%
Purchase Details
Closed on
Nov 11, 2002
Sold by
Barboza Carlos and Barboza Sonia
Home Financials for this Owner
Home Financials are based on the most recent Mortgage that was taken out on this home.
Original Mortgage
$75,000
Interest Rate
6.28%
Purchase Details
Closed on
Feb 6, 1994
Sold by
Dailey Sharon H
Purchase Details
Closed on
Jan 30, 1992
Purchase Details
Closed on
Jun 27, 1991
Create a Home Valuation Report for This Property
The Home Valuation Report is an in-depth analysis detailing your home's value as well as a comparison with similar homes in the area
Home Values in the Area
Average Home Value in this Area
Purchase History
| Date | Buyer | Sale Price | Title Company |
|---|---|---|---|
| Spears Shawna M | $115,500 | None Available | |
| -- | $100,500 | -- | |
| -- | -- | -- | |
| -- | -- | -- | |
| -- | -- | -- | |
| -- | -- | -- |
Source: Public Records
Mortgage History
| Date | Status | Borrower | Loan Amount |
|---|---|---|---|
| Open | Spears Shawna M | $152,757 | |
| Previous Owner | -- | $75,000 |
Source: Public Records
Tax History Compared to Growth
Tax History
| Year | Tax Paid | Tax Assessment Tax Assessment Total Assessment is a certain percentage of the fair market value that is determined by local assessors to be the total taxable value of land and additions on the property. | Land | Improvement |
|---|---|---|---|---|
| 2024 | $1,968 | $19,953 | $1,502 | $18,451 |
| 2023 | $1,968 | $19,372 | $1,440 | $17,932 |
| 2022 | $1,916 | $18,808 | $1,440 | $17,368 |
| 2021 | $1,902 | $18,260 | $1,440 | $16,820 |
| 2020 | $1,821 | $17,728 | $1,440 | $16,288 |
| 2019 | $1,842 | $17,212 | $1,440 | $15,772 |
| 2018 | $1,768 | $16,711 | $1,440 | $15,271 |
| 2017 | $1,829 | $16,935 | $1,440 | $15,495 |
| 2016 | $1,786 | $16,837 | $1,440 | $15,397 |
| 2015 | -- | $15,973 | $1,440 | $14,533 |
| 2014 | -- | $15,564 | $1,440 | $14,124 |
Source: Public Records
Map
Nearby Homes
- 508 SW 24th St
- 420 SW 24th St
- 1502 S Reno Ave
- 605 Thompson Dr
- 300 Cherokee Ln
- 601 Thompson Dr
- 800 Fairfax Ln
- 1309 Fairfax Ln
- 1705 S Dille Ave
- 1127 S Reno Ave
- 2502 Ridgecrest Dr
- 818 SW 26th Place
- 2606 Ridgecrest Dr
- 106 Slant St
- 1012 S Ellison Ave
- 1515 Strawberry Fields
- 1517 Strawberry
- 1519 Strawberry Fields
- 1523 Strawberry Fields
- 1220 Strawberry Fields
- 409 Amity Ln
- 504 Amity Ln
- 500 Amity Ln
- 511 Amity Ln
- 405 Amity Ln Unit 407
- 508 Amity Ln
- 1720 S Miles Ave
- 515 Amity Ln
- 504 SW 23rd St
- 401 Amity Ln Unit 403
- 10608 SW 23rd St
- 1600 S Miles Ave
- 1511 S Miles Ave
- 503 Skyline Dr
- 512 Amity Ln
- 505 Skyline Dr
- 516 Amity Ln
- 519 Amity Ln
- 1701 S Miles Ave
- 1509 S Miles Ave