NOT LISTED FOR SALE

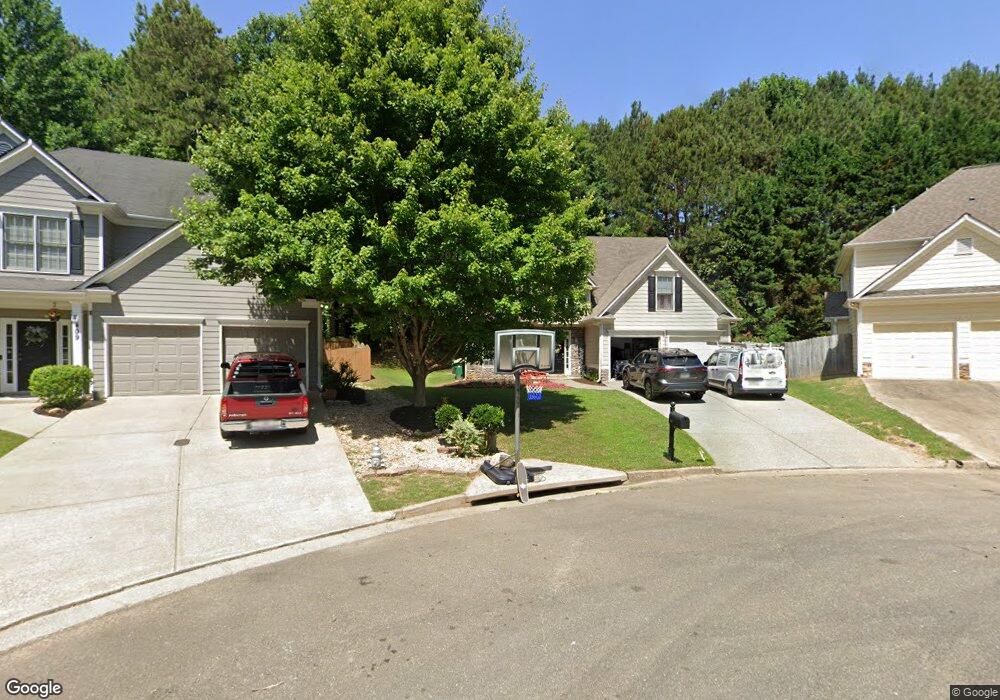
411 Azalea Cove Unit 2338 Canton, GA 30114

Sutallee Neighborhood

Estimated Value: $442,776 - $485,000

4 Beds
3 Baths
2,016 Sq Ft
$227/Sq Ft Est. Value

About This Home

This home is located at 411 Azalea Cove Unit 2338, Canton, GA 30114 and is currently estimated at $456,944, approximately $226 per square foot. 411 Azalea Cove Unit 2338 is a home located in Cherokee County with nearby schools including Sixes Elementary School, Freedom Middle School, and Woodstock High School.

Ownership History

Date Name Owned For Owner Type

Purchase Details

Closed on
Dec 1, 2017
Sold by
Freo Georgia Llc
Bought by
Progress Residential Borrower
Current Estimated Value
$456,944

Purchase Details

Closed on
Dec 14, 2016
Sold by
Nicholas A
Bought by
Freo Georgia Llc

Purchase Details

Closed on
Apr 14, 2006
Sold by
Secretary Of Hud
Bought by
Ferguson Nicholas A and Chaney Amanda

Home Financials for this Owner

Home Financials are based on the most recent Mortgage that was taken out on this home.
Original Mortgage
$148,880
Interest Rate
6.5%

Purchase Details

Closed on
Jul 5, 2005
Sold by
Union Fedl Bk Of Indianapolis
Bought by
Secretary Of Hud

Purchase Details

Closed on
May 2, 2002
Sold by
Weatherby & Assocs Inc
Bought by
Johnson Shannon

Home Financials for this Owner

Home Financials are based on the most recent Mortgage that was taken out on this home.
Original Mortgage
$178,105
Interest Rate
7.16%
Source: Public Records

Range of Values:

Collateral Analytics

Collateral Analytics Collateral Analytics AVMs (Automated Valuation Model) employ a number of statistical approaches combined with neighborhood-specific comparable selection guarantees the most up-to-date and precise valuations.

Not Available

Collateral Analytics does not have data for the current month. Please view the chart for historical values.

ICE

ICE Mortgage Technology ICE Mortgage Technology’s AVM (Automated Valuation Model) is a state-of-the-art online residential property valuation tool that provides a quick and accurate estimate of the value of almost any home in the U.S.

Not Available

ICE Mortgage Technology does not have data for the current month. Please view the chart for historical values.

First American

First American First American Data & Analytics’ next-generation AVM combines unrivaled data assets with a blended ensemble of valuation models to produce highly accurate, reliable valuations you can trust.

Not Available

First American does not have data for the current month. Please view the chart for historical values.

Quantarium

Quantarium Quantarium’s valuation service, repeatedly proven the industry’s most accurate and comprehensive, is supercharged with a self-learning and auto-tuning AI engine that continually becomes smarter and more accurate as it processes daily inputs from the industry’s leading RE data lake.

Not Available

Quantarium does not have data for the current month. Please view the chart for historical values.

Average Value
Not Available
List Price
Sold Price
Create a Home Valuation Report for This Property
The Home Valuation Report is an in-depth analysis detailing your home's value as well as a comparison with similar homes in the area

Home Values in the Area

Source: Public Records

Average Home Value in this Area


Source: Public Records

Purchase History

Date Buyer Sale Price Title Company
Progress Residential Borrower -- --
Freo Georgia Llc $217,000 --
Ferguson Nicholas A -- --
Secretary Of Hud -- --
Union Fedl Bk Of Indianapolis $200,273 --
Johnson Shannon $180,900 --
Source: Public Records

Mortgage History

Date Status Borrower Loan Amount
Previous Owner Ferguson Nicholas A $148,880
Previous Owner Johnson Shannon $179,249
Previous Owner Johnson Shannon $178,105
Source: Public Records

Tax History Compared to Growth

Source: Public Records

Tax History

Year Tax Paid Tax Assessment Tax Assessment Total Assessment is a certain percentage of the fair market value that is determined by local assessors to be the total taxable value of land and additions on the property. Land Improvement
2024 $4,271 $164,336 $34,000 $130,336
2023 $4,231 $162,804 $34,000 $128,804
2022 $2,471 $94,000 $21,110 $72,890
2021 $2,668 $94,000 $21,110 $72,890
2020 $2,671 $94,000 $21,110 $72,890
2019 $2,565 $90,280 $22,000 $68,280
2018 $2,427 $84,880 $20,800 $64,080
2017 $2,245 $194,800 $17,200 $60,720
2016 $2,241 $192,400 $17,200 $59,760
2015 $2,010 $170,900 $16,000 $52,360
2014 $1,901 $161,300 $14,000 $50,520
Source: Public Records

Map