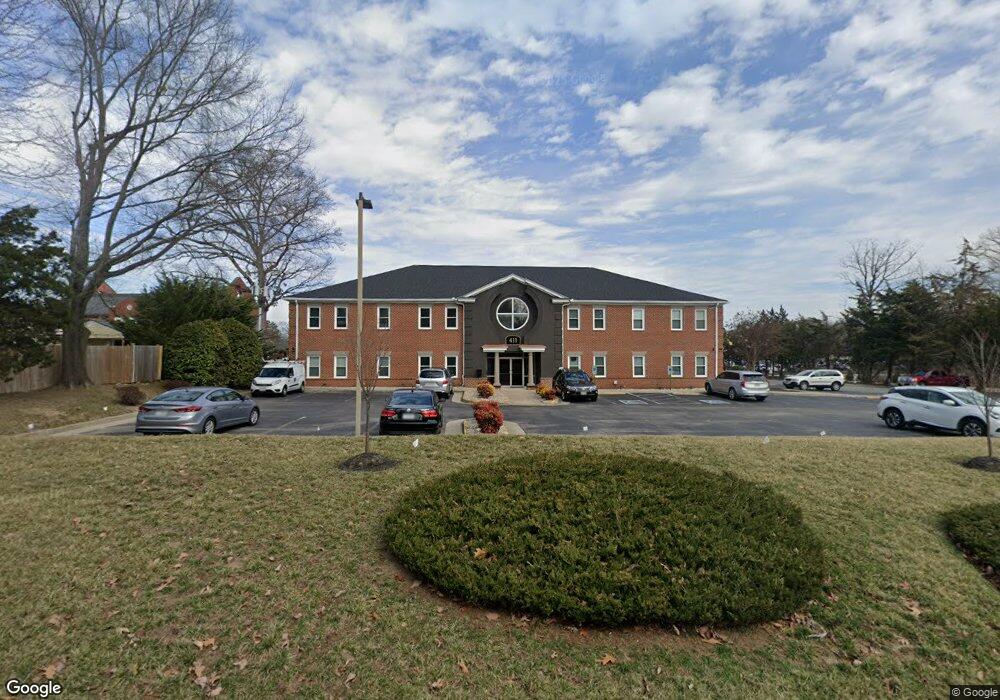
411 Branchway Rd North Chesterfield, VA 23236
--
Bed
--
Bath
5,088
Sq Ft
0.85
Acres
About This Home
This home is located at 411 Branchway Rd, North Chesterfield, VA 23236. 411 Branchway Rd is a home located in Chesterfield County with nearby schools including W W Gordon Elementary School, Midlothian Middle School, and Monacan High School.
Ownership History
Date
Name
Owned For
Owner Type
Purchase Details
Closed on
Jan 17, 2020
Sold by
East End Iv Llc
Bought by
Unified Properties Llc
Home Financials for this Owner
Home Financials are based on the most recent Mortgage that was taken out on this home.
Original Mortgage
$860,000
Outstanding Balance
$761,742
Interest Rate
3.73%
Mortgage Type
Unknown
Purchase Details
Closed on
Aug 7, 2017
Sold by
Shah Investments Llc A Virginia Limited
Bought by
East End Iv Llc A Virginia Limited Liabi
Purchase Details
Closed on
Dec 19, 2007
Sold by
Media Properties L L C
Bought by
Shah Investments L L C
Home Financials for this Owner
Home Financials are based on the most recent Mortgage that was taken out on this home.
Original Mortgage
$1,325,000
Interest Rate
6.02%
Mortgage Type
Construction
Purchase Details
Closed on
Mar 26, 1996
Sold by
Katherman Robert V and Balzer Donald J
Bought by
Media Properties Llc
Create a Home Valuation Report for This Property
The Home Valuation Report is an in-depth analysis detailing your home's value as well as a comparison with similar homes in the area
Home Values in the Area
Average Home Value in this Area
Purchase History
| Date | Buyer | Sale Price | Title Company |
|---|---|---|---|
| Unified Properties Llc | $860,000 | Attorney | |
| East End Iv Llc A Virginia Limited Liabi | $600,000 | Attorney | |
| Shah Investments L L C | $2,075,000 | -- | |
| Media Properties Llc | $85,000 | -- |
Source: Public Records
Mortgage History
| Date | Status | Borrower | Loan Amount |
|---|---|---|---|
| Open | Unified Properties Llc | $860,000 | |
| Previous Owner | Shah Investments L L C | $1,325,000 |
Source: Public Records
Tax History Compared to Growth
Tax History
| Year | Tax Paid | Tax Assessment Tax Assessment Total Assessment is a certain percentage of the fair market value that is determined by local assessors to be the total taxable value of land and additions on the property. | Land | Improvement |
|---|---|---|---|---|
| 2025 | $7,932 | $875,500 | $180,400 | $695,100 |
| 2024 | $7,932 | $829,400 | $180,400 | $649,000 |
| 2023 | $7,942 | $872,800 | $180,400 | $692,400 |
| 2022 | $10,050 | $1,092,400 | $150,900 | $941,500 |
| 2021 | $10,518 | $1,092,400 | $150,900 | $941,500 |
| 2020 | $10,378 | $1,092,400 | $150,900 | $941,500 |
| 2019 | $10,378 | $1,092,400 | $147,900 | $944,500 |
| 2018 | $10,403 | $1,092,400 | $147,900 | $944,500 |
| 2017 | $10,288 | $1,057,100 | $147,900 | $909,200 |
| 2016 | $10,148 | $1,057,100 | $147,900 | $909,200 |
| 2015 | $10,148 | $1,057,100 | $147,900 | $909,200 |
| 2014 | $9,694 | $1,009,800 | $147,900 | $861,900 |
Source: Public Records
Map
Nearby Homes
- 701 N Courthouse Rd
- 149 N Courthouse Rd
- 10965 Keithwood Pkwy
- 11151 Research Plaza Way
- 221 Farnham Dr
- 206 Twin Crest Dr
- 61 Reykin Dr
- 11761 Edenberry Dr
- 100 Moorwood Ridge Dr
- 11603 Durrington Dr
- 645 Farnham Cir
- 11200 Lady Slipper Ln
- 11312 McCauliff Ct
- 11617 Olde Coach Dr
- 1221 Warminster Dr
- 32 Mistywood Rd
- 1516 Sandgate Rd
- 12406 Carnoustie Ln Unit B
- 1040 Black Heath Rd
- 121 Avebury Dr
- 421 Branchway Rd
- 501 Branchway Rd
- 401 Branchway Rd
- 413 Branchway Rd
- 507 Branchway Rd
- 501 Courthouse Rd
- 525 Branchway Rd
- 523 Branchway Rd
- 527 Branchway Rd
- 11300 Edenberry Dr
- 535 Branchway Rd
- 521 Branchway Rd
- 428 N Courthouse Rd
- 519 Branchway Rd
- 417 Branchway Rd
- 311 N Courthouse Rd
- 511 Branchway Rd
- 2601 N Courthouse Rd
- 11310 Edenberry Dr
- 419 Branchway Rd