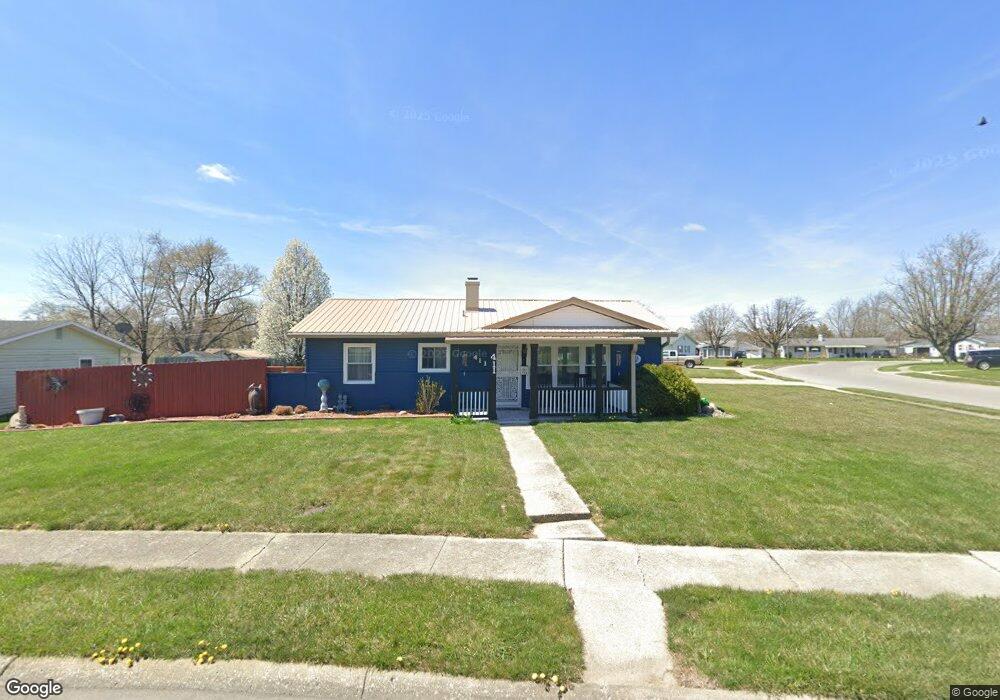
411 Brinker Dr Marion, IN 46952
Northeast Marion NeighborhoodEstimated Value: $110,000 - $136,571
About This Home
This home is located at 411 Brinker Dr, Marion, IN 46952 and is currently estimated at $121,893, approximately $118 per square foot. 411 Brinker Dr is a home located in Grant County with nearby schools including Allen Elementary School, John L. McCulloch Junior High School, and Justice Thurgood Marshall Intermediate School.
Ownership History
We collect this data history from publicly available records. To have your information removed, we recommend requesting removal directly through your county’s website.
Purchase Details
Home Financials for this Owner
Home Financials are based on the most recent Mortgage that was taken out on this home.Home Values in the Area
Average Home Value in this Area
Purchase History
We collect this data history from publicly available records. To have your information removed, we recommend requesting removal directly through your county’s website.
| Date | Buyer | Sale Price | Title Company |
|---|---|---|---|
| -- | None Available |
Mortgage History
We collect this data history from publicly available records. To have your information removed, we recommend requesting removal directly through your county’s website.
| Date | Status | Borrower | Loan Amount |
|---|---|---|---|
| Open | $64,136 |
Tax History
We collect this data history from publicly available records. To have your information removed, we recommend requesting removal directly through your county’s website.
| Year | Tax Paid | Tax Assessment Tax Assessment Total Assessment is a certain percentage of the fair market value that is determined by local assessors to be the total taxable value of land and additions on the property. | Land | Improvement |
|---|---|---|---|---|
| 2025 | $1,002 | $111,300 | $13,700 | $97,600 |
| 2024 | $991 | $99,100 | $13,700 | $85,400 |
| 2023 | $944 | $96,500 | $13,700 | $82,800 |
| 2022 | $699 | $80,800 | $11,600 | $69,200 |
| 2021 | $562 | $72,300 | $11,600 | $60,700 |
| 2020 | $501 | $72,200 | $14,500 | $57,700 |
| 2019 | $473 | $72,200 | $14,500 | $57,700 |
| 2018 | $386 | $66,200 | $14,500 | $51,700 |
| 2017 | $358 | $64,200 | $14,500 | $49,700 |
| 2016 | $313 | $61,200 | $11,600 | $49,600 |
| 2014 | $339 | $65,700 | $11,600 | $54,100 |
| 2013 | $339 | $64,400 | $11,600 | $52,800 |
Map
- 308 N Campbell Ave
- 321 N Vickery Ln
- 410 N Vickery Ln
- 703 N Mcclure St
- 618 N Branson St
- 1403 E Elm Ln
- 528 E Wiley St
- 315 N Adams St
- 622 N Washington St
- 624 N Washington St
- 215 E 3rd St
- 602 E Christy St
- 932 N Washington St
- 0 W 27th St
- 215 W Swayzee St
- 412 E Christy St
- 114 E Highland Ave
- 101 S Nebraska St
- 420 W 1st St
- 935 S Branson St
- 407 Brinker Dr
- 409 Brinker Dr
- 405 Brinker Dr
- 1005 E Sherman St
- 1003 E Sherman St
- 403 Brinker Dr
- 1007 E Sherman St
- 406 N Keal Ave
- 1004 E Marshall St
- 410 Brinker Dr
- 404 N Keal Ave
- 408 N Keal Ave
- 412 Brinker Dr
- 408 Brinker Dr
- 313 Brinker Dr
- 500 N Keal Ave
- 1009 E Sherman St
- 1104 Brinker Ct
- 502 N Keal Ave
- 311 Brinker Dr
Ask me questions while you tour the home.