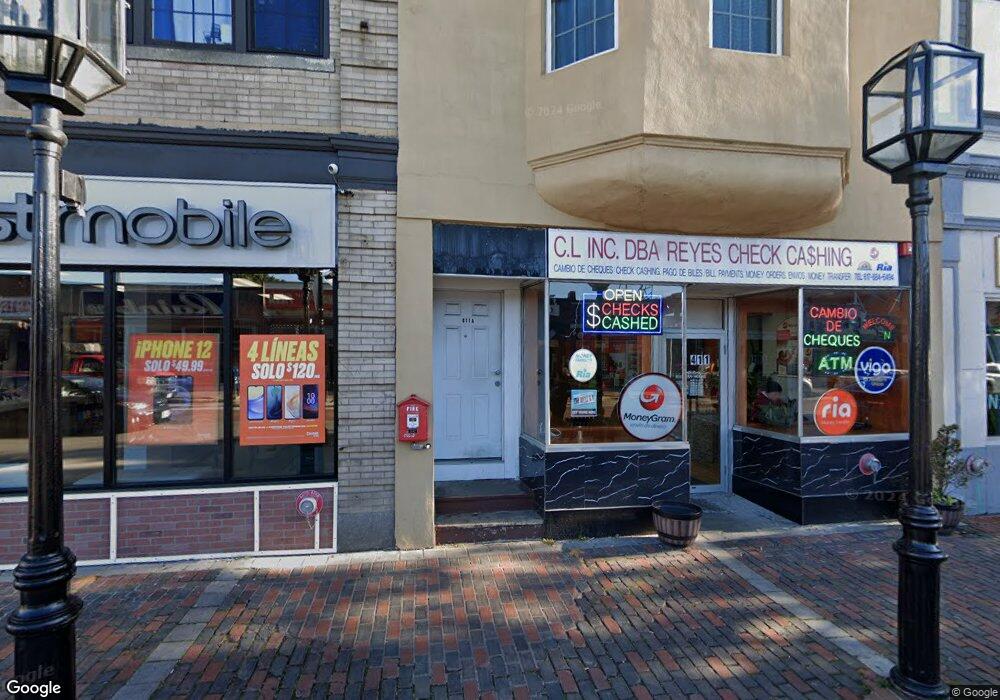
411 Broadway Chelsea, MA 02150
Bellingham Square NeighborhoodEstimated Value: $643,589
6
Beds
4
Baths
3,458
Sq Ft
$186/Sq Ft
Est. Value
About This Home
This home is located at 411 Broadway, Chelsea, MA 02150 and is currently priced at $643,589, approximately $186 per square foot. 411 Broadway is a home located in Suffolk County with nearby schools including Chelsea High School and Phoenix Charter Academy - Chelsea.
Ownership History
Date
Name
Owned For
Owner Type
Purchase Details
Closed on
Nov 9, 2011
Sold by
Cdl Realty Llc
Bought by
Hua Xia Rt and Ren
Current Estimated Value
Purchase Details
Closed on
May 15, 2000
Sold by
Meltzer Familty Rt
Bought by
Cdl Rlty Llc
Home Financials for this Owner
Home Financials are based on the most recent Mortgage that was taken out on this home.
Original Mortgage
$150,000
Interest Rate
8.21%
Mortgage Type
Commercial
Create a Home Valuation Report for This Property
The Home Valuation Report is an in-depth analysis detailing your home's value as well as a comparison with similar homes in the area
Home Values in the Area
Average Home Value in this Area
Purchase History
| Date | Buyer | Sale Price | Title Company |
|---|---|---|---|
| Hua Xia Rt | $275,000 | -- | |
| Hua Xia Rt | $275,000 | -- | |
| Cdl Rlty Llc | $150,000 | -- | |
| Cdl Rlty Llc | $150,000 | -- |
Source: Public Records
Mortgage History
| Date | Status | Borrower | Loan Amount |
|---|---|---|---|
| Previous Owner | Cdl Rlty Llc | $60,000 | |
| Previous Owner | Cdl Rlty Llc | $150,000 |
Source: Public Records
Tax History Compared to Growth
Tax History
| Year | Tax Paid | Tax Assessment Tax Assessment Total Assessment is a certain percentage of the fair market value that is determined by local assessors to be the total taxable value of land and additions on the property. | Land | Improvement |
|---|---|---|---|---|
| 2025 | $0 | $954,200 | $150,200 | $804,000 |
| 2024 | $11,449 | $880,200 | $143,300 | $736,900 |
| 2023 | $0 | $684,900 | $143,300 | $541,600 |
| 2022 | $0 | $668,400 | $143,300 | $525,100 |
| 2021 | $0 | $595,800 | $136,500 | $459,300 |
| 2020 | $0 | $589,200 | $129,900 | $459,300 |
| 2019 | $10,601 | $363,800 | $129,900 | $233,900 |
| 2018 | $0 | $354,700 | $129,900 | $224,800 |
| 2017 | $0 | $294,700 | $129,900 | $164,800 |
| 2016 | $5,130 | $291,200 | $129,900 | $161,300 |
| 2015 | $5,130 | $284,300 | $129,900 | $154,400 |
| 2014 | $5,130 | $258,500 | $118,100 | $140,400 |
Source: Public Records
Map
Nearby Homes
- 230 Chestnut St
- 221 Shurtleff St Unit 2
- 163 Chestnut St
- 139 Park St Unit 4
- 29 Cottage St
- 70 Chester Ave Unit 72
- 50 Maverick St Unit 3
- 65 6th St
- 110 Bellingham St Unit 1
- 110 Bellingham St Unit 3
- 11 Williams St
- 78 Winnisimmet St
- 144 Library St
- 39 Cary Ave Unit 14
- 40 Williams St Unit C
- 33 Cary Ave Unit 11
- 250 Congress Ave Unit 40
- 16 Tremont St Unit 2
- 78 Addison St Unit B
- 34 Tremont St Unit 6
- 411 Broadway Unit 3F
- 411 Broadway Unit 3R
- 407 Broadway Unit 2
- 407 Broadway Unit 1
- 407 Broadway
- 409 Broadway Unit 1
- 423 Broadway
- 427 Broadway Unit 2
- 425 Broadway
- 417 Broadway Unit 2
- 417 Broadway Unit 1
- 425 Broadway Unit 3
- 425 Broadway Unit 2
- 425 Broadway Unit 1
- 399 Broadway Unit 3
- 399 Broadway Unit 2
- 399 Broadway Unit 2&3
- 399 Broadway
- 413 Broadway
- 403 Broadway Unit 405